

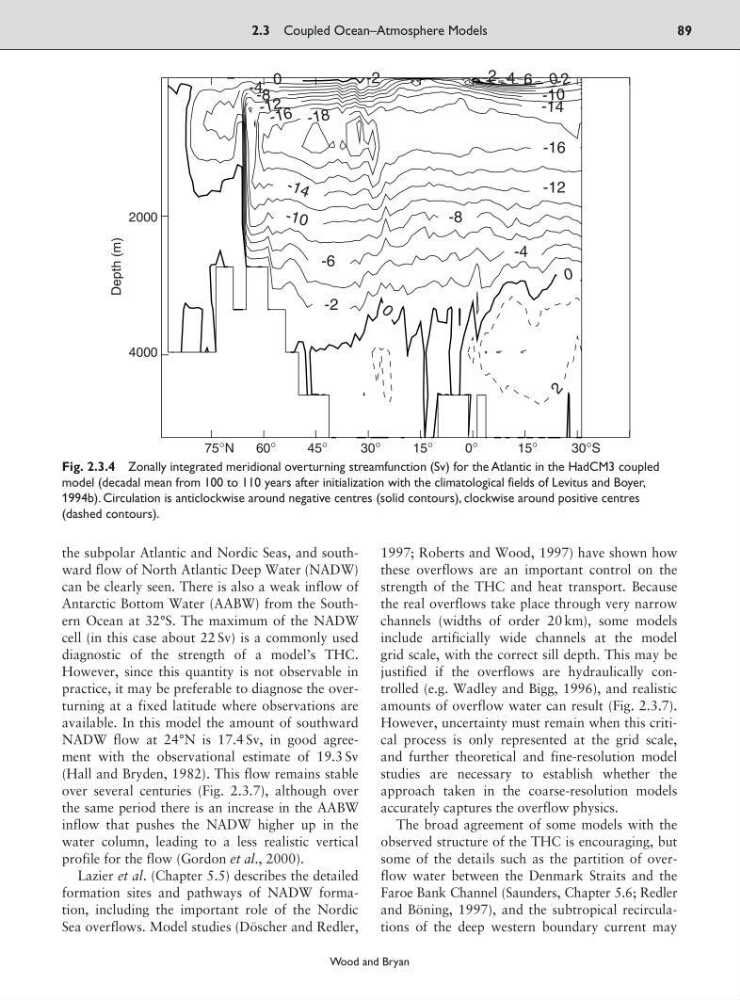
the subpolar Atlantic and Nordic Seas, and southward flow of North Atlantic Deep Water (NADW)
can be clearly seen. There is also a weak inflow of
Antarctic Bottom Water (AABW) from the Southern Ocean at 32°S. The maximum of the NADW
cell (in this case about 22 Sv) is a commonly used
diagnostic of the strength of a model’s THC.
However, since this quantity is not observable in
practice, it may be preferable to diagnose the overturning at a fixed latitude where observations are
available. In this model the amount of southward
NADW flow at 24°N is 17.4 Sv, in good agreement with the observational estimate of 19.3 Sv
(Hall and Bryden, 1982). This flow remains stable
over several centuries (Fig. 2.3.7), although over
the same period there is an increase in the AABW
inflow that pushes the NADW higher up in the
water column, leading to a less realistic vertical
profile for the flow (Gordon et al., 2000).
Lazier et al. (Chapter 5.5) describes the detailed
formation sites and pathways of NADW formation, including the important role of the Nordic
Sea overflows. Model studies (Döscher and Redler,
1997; Roberts and Wood, 1997) have shown how
these overflows are an important control on the
strength of the THC and heat transport. Because
the real overflows take place through very narrow
channels (widths of order 20 km), some models
include artificially wide channels at the model
grid scale, with the correct sill depth. This may be
justified if the overflows are hydraulically controlled (e.g. Wadley and Bigg, 1996), and realistic
amounts of overflow water can result (Fig. 2.3.7).
However, uncertainty must remain when this critical process is only represented at the grid scale,
and further theoretical and fine-resolution model
studies are necessary to establish whether the
approach taken in the coarse-resolution models
accurately captures the overflow physics.
The broad agreement of some models with the
observed structure of the THC is encouraging, but
some of the details such as the partition of overflow water between the Denmark Straits and the
Faroe Bank Channel (Saunders, Chapter 5.6; Redler
and Böning, 1997), and the subtropical recirculations of the deep western boundary current may
2.3 Coupled Ocean–Atmosphere Models
89
Wood and Bryan
2
0
0
0
0
-2
- 2
-2
-6
-4
-4
-1 0
-10
-8
-8
- 1 4
-14
-12
-1 2
-16
-1 6 -1 8
2 4 6
2000
4000
Depth (m)
75°N
4 5 °
60°
30°
15°
0°
15°
30°S
Fig. 2.3.4 Zonally integrated meridional overturning streamfunction (Sv) for the Atlantic in the HadCM3 coupled
model (decadal mean from 100 to 110 years after initialization with the climatological fields of Levitus and Boyer,
1994b). Circulation is anticlockwise around negative centres (solid contours), clockwise around positive centres
(dashed contours).
can be clearly seen. There is also a weak inflow of
Antarctic Bottom Water (AABW) from the Southern Ocean at 32°S. The maximum of the NADW
cell (in this case about 22 Sv) is a commonly used
diagnostic of the strength of a model’s THC.
However, since this quantity is not observable in
practice, it may be preferable to diagnose the overturning at a fixed latitude where observations are
available. In this model the amount of southward
NADW flow at 24°N is 17.4 Sv, in good agreement with the observational estimate of 19.3 Sv
(Hall and Bryden, 1982). This flow remains stable
over several centuries (Fig. 2.3.7), although over
the same period there is an increase in the AABW
inflow that pushes the NADW higher up in the
water column, leading to a less realistic vertical
profile for the flow (Gordon et al., 2000).
Lazier et al. (Chapter 5.5) describes the detailed
formation sites and pathways of NADW formation, including the important role of the Nordic
Sea overflows. Model studies (Döscher and Redler,
1997; Roberts and Wood, 1997) have shown how
these overflows are an important control on the
strength of the THC and heat transport. Because
the real overflows take place through very narrow
channels (widths of order 20 km), some models
include artificially wide channels at the model
grid scale, with the correct sill depth. This may be
justified if the overflows are hydraulically controlled (e.g. Wadley and Bigg, 1996), and realistic
amounts of overflow water can result (Fig. 2.3.7).
However, uncertainty must remain when this critical process is only represented at the grid scale,
and further theoretical and fine-resolution model
studies are necessary to establish whether the
approach taken in the coarse-resolution models
accurately captures the overflow physics.
The broad agreement of some models with the
observed structure of the THC is encouraging, but
some of the details such as the partition of overflow water between the Denmark Straits and the
Faroe Bank Channel (Saunders, Chapter 5.6; Redler
and Böning, 1997), and the subtropical recirculations of the deep western boundary current may
2.3 Coupled Ocean–Atmosphere Models
89
Wood and Bryan
2
0
0
0
0
-2
- 2
-2
-6
-4
-4
-1 0
-10
-8
-8
- 1 4
-14
-12
-1 2
-16
-1 6 -1 8
2 4 6
2000
4000
Depth (m)
75°N
4 5 °
60°
30°
15°
0°
15°
30°S
Fig. 2.3.4 Zonally integrated meridional overturning streamfunction (Sv) for the Atlantic in the HadCM3 coupled
model (decadal mean from 100 to 110 years after initialization with the climatological fields of Levitus and Boyer,
1994b). Circulation is anticlockwise around negative centres (solid contours), clockwise around positive centres
(dashed contours).