

alone may account for 20% of the total global CO
flux. Although the marine source is responsible for
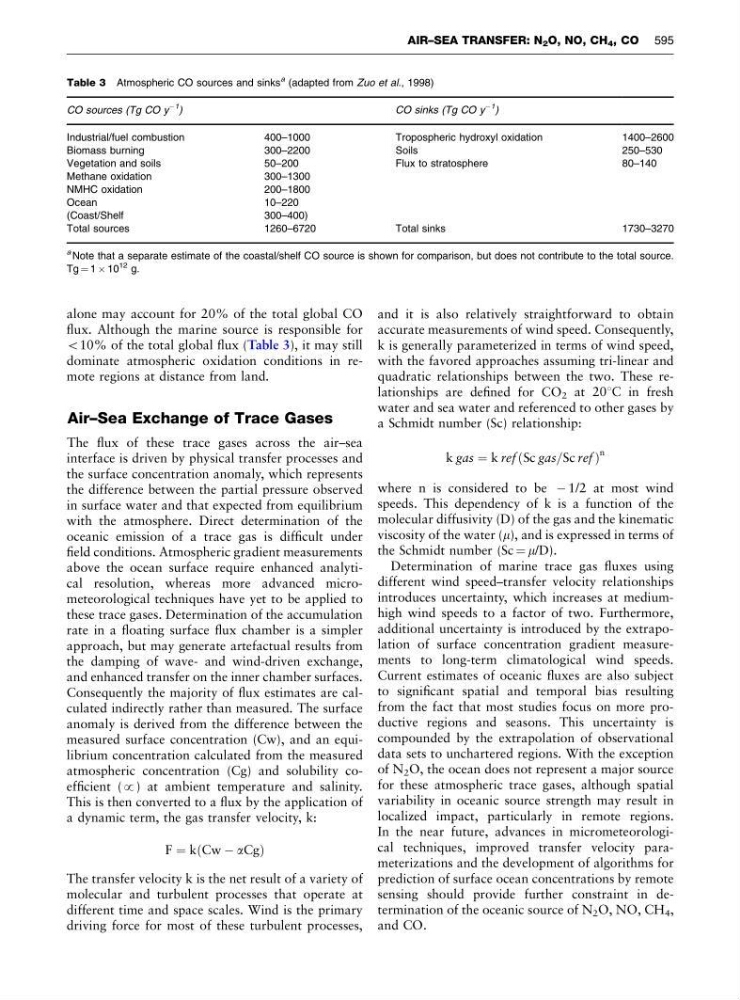
o10% of the total global flux (Table 3), it may still
dominate atmospheric oxidation conditions in remote regions at distance from land.
Air–Sea Exchange of Trace Gases
The flux of these trace gases across the air–sea
interface is driven by physical transfer processes and
the surface concentration anomaly, which represents
the difference between the partial pressure observed
in surface water and that expected from equilibrium
with the atmosphere. Direct determination of the
oceanic emission of a trace gas is difficult under
field conditions. Atmospheric gradient measurements
above the ocean surface require enhanced analytical resolution, whereas more advanced micrometeorological techniques have yet to be applied to
these trace gases. Determination of the accumulation
rate in a floating surface flux chamber is a simpler
approach, but may generate artefactual results from
the damping of wave- and wind-driven exchange,
and enhanced transfer on the inner chamber surfaces.
Consequently the majority of flux estimates are calculated indirectly rather than measured. The surface
anomaly is derived from the difference between the
measured surface concentration (Cw), and an equilibrium concentration calculated from the measured
atmospheric concentration (Cg) and solubility coefficient (p) at ambient temperature and salinity.
This is then converted to a flux by the application of
a dynamic term, the gas transfer velocity, k:
F ¼ k Cw À aCg
ð
Þ
The transfer velocity k is the net result of a variety of
molecular and turbulent processes that operate at
different time and space scales. Wind is the primary
driving force for most of these turbulent processes,
and it is also relatively straightforward to obtain
accurate measurements of wind speed. Consequently,
k is generally parameterized in terms of wind speed,
with the favored approaches assuming tri-linear and
quadratic relationships between the two. These relationships are defined for CO 2 at 201C in fresh
water and sea water and referenced to other gases by
a Schmidt number (Sc) relationship:
k gas ¼ k ref Sc gas=Sc ref
ð
Þ
n
where n is considered to be À 1/2 at most wind
speeds. This dependency of k is a function of the
molecular diffusivity (D) of the gas and the kinematic
viscosity of the water (m), and is expressed in terms of
the Schmidt number (Sc ¼ m/D).
Determination of marine trace gas fluxes using
different wind speed–transfer velocity relationships
introduces uncertainty, which increases at mediumhigh wind speeds to a factor of two. Furthermore,
additional uncertainty is introduced by the extrapolation of surface concentration gradient measurements to long-term climatological wind speeds.
Current estimates of oceanic fluxes are also subject
to significant spatial and temporal bias resulting
from the fact that most studies focus on more productive regions and seasons. This uncertainty is
compounded by the extrapolation of observational
data sets to unchartered regions. With the exception
of N 2 O, the ocean does not represent a major source
for these atmospheric trace gases, although spatial
variability in oceanic source strength may result in
localized impact, particularly in remote regions.
In the near future, advances in micrometeorological techniques, improved transfer velocity parameterizations and the development of algorithms for
prediction of surface ocean concentrations by remote
sensing should provide further constraint in determination of the oceanic source of N 2 O, NO, CH 4 ,
and CO.
Table 3 Atmospheric CO sources and sinks
a (adapted from Zuo et al., 1998)
CO sources (Tg CO y
À1
)
CO sinks (Tg CO y
À1 )
Industrial/fuel combustion
400–1000
Tropospheric hydroxyl oxidation
1400–2600
Biomass burning
300–2200
Soils
250–530
Vegetation and soils
50–200
Flux to stratosphere
80–140
Methane oxidation
300–1300
NMHC oxidation
200–1800
Ocean
10–220
(Coast/Shelf
300–400)
Total sources
1260–6720
Total sinks
1730–3270
a Note that a separate estimate of the coastal/shelf CO source is shown for comparison, but does not contribute to the total source.
Tg ¼ 1 Â 10
12 g.
AIR–SEA TRANSFER: N 2 O, NO, CH 4 , CO 595