

subsequent conversion to N 2 (often referred to as the
ammonia ‘distillation’ and ‘diffusion’ methods). Recently, more sensitive isotope analysis methods (requiring only 5–10 nmol of N per analysis) have been
developed for nitrate and nitrite in which these species are converted to nitrous oxide (N 2 O), followed
by isotopic analysis of this gas (the ‘bacterial’ or
‘denitrifier’ method and the ‘chemical’ or ‘azide’
method). The N 2 O produced by these methods (or
naturally occuring N 2 O) is analyzed by a purge and
trap system, followed by gas chromatography and
isotope ratio mass spectrometry. The N 2 O-based
methods also allow for oxygen isotope analysis of
nitrate and nitrite, a measurement not previously
possible in seawater. In addition, they provide a
cornerstone for isotopic analysis of other dissolved
forms of N, such as dissolved organic N (DON) and
ammonium (NH 4
þ ), which can be converted to nitrate and/or nitrite. With respect to dissolved gases,
methods of collection and isotopic analysis have
been developed for N 2 and N 2 O, with recent progress on isotopomer analysis of N 2 O (i.e., distinguishing
15
N
14 N
16 O from
14 N
15 N
16 O).
Models
Two simple models, the ‘Rayleigh’ model and the
‘steady-state’ model, are frequently used to interpret
N isotope data from the ocean. In both of these
models, the degree of consumption of the reactant N
pool (f ) is a key parameter, and the d
15 N of the
initial reactant N pool (d
15 N initial ) and kinetic isotope
effect (e) are the two central isotopic parameters.
If a transformation proceeds with a constant isotope
effect and if the reactant and product N pools are
neither replenished nor lost from the system during
the progress of the transformation, then the process
can be described in terms of Rayleigh fractionation kinetics, which define the isotopic variation of
the reactant N pool (d
15 N reactant ; eqn [3]), the instantaneously generated product N (d
15 N instantaneous ;
eqn [4]), and the integrated product N pool
(d
15 N integrated ; eqn [5]) as a given reservoir of reactant
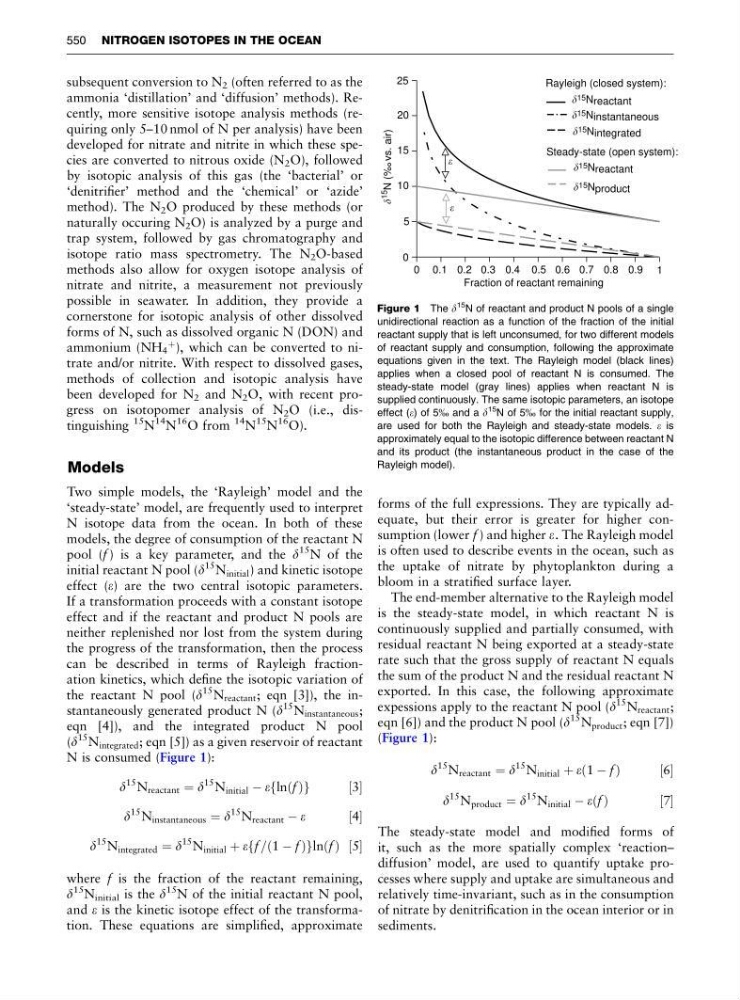
N is consumed (Figure 1):
d
15 N reactant ¼ d
15 N initial À eflnðf Þg
½3
d
15 N instantaneous ¼ d
15 N reactant À e
½4
d
15 N integrated ¼ d
15 N initial þ eff =ð1 À f Þglnðf Þ ½5
where f is the fraction of the reactant remaining,
d
15 N initial is the d
15
N of the initial reactant N pool,
and e is the kinetic isotope effect of the transformation. These equations are simplified, approximate
forms of the full expressions. They are typically adequate, but their error is greater for higher consumption (lower f ) and higher e. The Rayleigh model
is often used to describe events in the ocean, such as
the uptake of nitrate by phytoplankton during a
bloom in a stratified surface layer.
The end-member alternative to the Rayleigh model
is the steady-state model, in which reactant N is
continuously supplied and partially consumed, with
residual reactant N being exported at a steady-state
rate such that the gross supply of reactant N equals
the sum of the product N and the residual reactant N
exported. In this case, the following approximate
expessions apply to the reactant N pool (d
15 N reactant ;
eqn [6]) and the product N pool (d
15 N product ; eqn [7])
(Figure 1):
d
15 N reactant ¼ d
15 N initial þ eð1 À f Þ
½6
d
15 N product ¼ d
15 N initial À eðf Þ
½ 7
The steady-state model and modified forms of
it, such as the more spatially complex ‘reaction–
diffusion’ model, are used to quantify uptake processes where supply and uptake are simultaneous and
relatively time-invariant, such as in the consumption
of nitrate by denitrification in the ocean interior or in
sediments.
0
5
10
15
20
25
0 0.1 0.2 0.3 0.4 0.5 0.6 0.7 0.8 0.9 1
Fraction of reactant remaining
15
N (% vs. air)
15 N reactant
15 N instantaneous
15 N integrated
15 N reactant
15 N product
Rayleigh (closed system):
Steady-state (open system):
Figure 1 The d
15 N of reactant and product N pools of a single
unidirectional reaction as a function of the fraction of the initial
reactant supply that is left unconsumed, for two different models
of reactant supply and consumption, following the approximate
equations given in the text. The Rayleigh model (black lines)
applies when a closed pool of reactant N is consumed. The
steady-state model (gray lines) applies when reactant N is
supplied continuously. The same isotopic parameters, an isotope
effect (e) of 5% and a d
15 N of 5% for the initial reactant supply,
are used for both the Rayleigh and steady-state models. e is
approximately equal to the isotopic difference between reactant N
and its product (the instantaneous product in the case of the
Rayleigh model).
550 NITROGEN ISOTOPES IN THE OCEAN
ammonia ‘distillation’ and ‘diffusion’ methods). Recently, more sensitive isotope analysis methods (requiring only 5–10 nmol of N per analysis) have been
developed for nitrate and nitrite in which these species are converted to nitrous oxide (N 2 O), followed
by isotopic analysis of this gas (the ‘bacterial’ or
‘denitrifier’ method and the ‘chemical’ or ‘azide’
method). The N 2 O produced by these methods (or
naturally occuring N 2 O) is analyzed by a purge and
trap system, followed by gas chromatography and
isotope ratio mass spectrometry. The N 2 O-based
methods also allow for oxygen isotope analysis of
nitrate and nitrite, a measurement not previously
possible in seawater. In addition, they provide a
cornerstone for isotopic analysis of other dissolved
forms of N, such as dissolved organic N (DON) and
ammonium (NH 4
þ ), which can be converted to nitrate and/or nitrite. With respect to dissolved gases,
methods of collection and isotopic analysis have
been developed for N 2 and N 2 O, with recent progress on isotopomer analysis of N 2 O (i.e., distinguishing
15
N
14 N
16 O from
14 N
15 N
16 O).
Models
Two simple models, the ‘Rayleigh’ model and the
‘steady-state’ model, are frequently used to interpret
N isotope data from the ocean. In both of these
models, the degree of consumption of the reactant N
pool (f ) is a key parameter, and the d
15 N of the
initial reactant N pool (d
15 N initial ) and kinetic isotope
effect (e) are the two central isotopic parameters.
If a transformation proceeds with a constant isotope
effect and if the reactant and product N pools are
neither replenished nor lost from the system during
the progress of the transformation, then the process
can be described in terms of Rayleigh fractionation kinetics, which define the isotopic variation of
the reactant N pool (d
15 N reactant ; eqn [3]), the instantaneously generated product N (d
15 N instantaneous ;
eqn [4]), and the integrated product N pool
(d
15 N integrated ; eqn [5]) as a given reservoir of reactant
N is consumed (Figure 1):
d
15 N reactant ¼ d
15 N initial À eflnðf Þg
½3
d
15 N instantaneous ¼ d
15 N reactant À e
½4
d
15 N integrated ¼ d
15 N initial þ eff =ð1 À f Þglnðf Þ ½5
where f is the fraction of the reactant remaining,
d
15 N initial is the d
15
N of the initial reactant N pool,
and e is the kinetic isotope effect of the transformation. These equations are simplified, approximate
forms of the full expressions. They are typically adequate, but their error is greater for higher consumption (lower f ) and higher e. The Rayleigh model
is often used to describe events in the ocean, such as
the uptake of nitrate by phytoplankton during a
bloom in a stratified surface layer.
The end-member alternative to the Rayleigh model
is the steady-state model, in which reactant N is
continuously supplied and partially consumed, with
residual reactant N being exported at a steady-state
rate such that the gross supply of reactant N equals
the sum of the product N and the residual reactant N
exported. In this case, the following approximate
expessions apply to the reactant N pool (d
15 N reactant ;
eqn [6]) and the product N pool (d
15 N product ; eqn [7])
(Figure 1):
d
15 N reactant ¼ d
15 N initial þ eð1 À f Þ
½6
d
15 N product ¼ d
15 N initial À eðf Þ
½ 7
The steady-state model and modified forms of
it, such as the more spatially complex ‘reaction–
diffusion’ model, are used to quantify uptake processes where supply and uptake are simultaneous and
relatively time-invariant, such as in the consumption
of nitrate by denitrification in the ocean interior or in
sediments.
0
5
10
15
20
25
0 0.1 0.2 0.3 0.4 0.5 0.6 0.7 0.8 0.9 1
Fraction of reactant remaining
15
N (% vs. air)
15 N reactant
15 N instantaneous
15 N integrated
15 N reactant
15 N product
Rayleigh (closed system):
Steady-state (open system):
Figure 1 The d
15 N of reactant and product N pools of a single
unidirectional reaction as a function of the fraction of the initial
reactant supply that is left unconsumed, for two different models
of reactant supply and consumption, following the approximate
equations given in the text. The Rayleigh model (black lines)
applies when a closed pool of reactant N is consumed. The
steady-state model (gray lines) applies when reactant N is
supplied continuously. The same isotopic parameters, an isotope
effect (e) of 5% and a d
15 N of 5% for the initial reactant supply,
are used for both the Rayleigh and steady-state models. e is
approximately equal to the isotopic difference between reactant N
and its product (the instantaneous product in the case of the
Rayleigh model).
550 NITROGEN ISOTOPES IN THE OCEAN