

found in the works by Treguer et al. and DeMaster
(listed in Further Reading).
All of these sources of silicate to the oceanic water
column are considered to be external. As shown in
Figure 3, there are internal sources supplying silicate
to oceanic surface waters and they are oceanic upwelling and turbulence. Because of the strong gradient in silicate with depth, upwelling of subsurface
water (100–200 m depth) by wind-induced processes
and turbulence can bring substantial amounts of this
nutrient (and others) to surface waters that typically
would be depleted in these valuable chemical resources as a result of biological activity. This upwelling flux (B100 À 300 Â 10
12 mol Si y
À1 ), in fact,
is 20–50 times greater than the riverine flux. The
extraction of silicate from surface waters by siliceous
biota is so efficient that nearly 100% of the nutrient
reaching the surface is converted into biogenic silica.
Therefore, the production of biogenic silica in
oceanic surface waters is comparable to the flux from
upwelling and turbulent transport. Riverine sources
may be the dominant external source of silicate to
the oceans, but they sustain only a negligible amount
(only a few percent) of the overall marine silica
production. Internal recycling, upwelling, and turbulence provide nearly all of the silicate necessary to
sustain the gross silica production in marine surface
waters. Therefore, changes in oceanic stratification
and wind intensity may significantly affect the flux of
nutrients to the surface and the overall efficiency of
the biological pump. Silicate dynamics in the water
column have been simulated using a general circulation model. The results of this study by Gnanadesikan suggest that the model distributions of silicate
in the ocean are very sensitive to the parametrization
of the turbulent flux. In addition, according to the
model, the Southern Ocean and the North Pacific
were the two major open-ocean sites where net silica
production occurred, accounting for nearly 80% of
the biogenic silica leaving the photic zone.
If the entire ocean (surface waters, deep waters,
and near-surface sediments) is considered as a single
box, the external fluxes of silicate to the ocean
(mentioned above) must be balanced by removal
terms in order to maintain the silicate levels in the
ocean at more or less a constant value over geological time. From this point of view the flux of
silicate from oceanic upwelling and turbulence can
be treated as part of an internal cycle. The dominant
mechanism removing silica from this system is burial
of biogenic silica. There is some controversy about
where some of this burial takes place, but most scientists believe that burial of biogenic silica (or some
chemically altered by-product thereof) is the primary
way that silicate is removed from the ocean.
Removal of Silica from the Ocean
The sediments with the highest rate of silica accumulation (on an areal basis) occur beneath the
coastal upwelling zones, where strong winds bring
extensive amounts of nutrients to the surface. Examples of these upwelling areas include the west
coast of Peru, the Gulf of California, and Walvis Bay
(off the west coast of South Africa). Diatom skeletons are the dominant form of biogenic silica in
these deposits. The sediments in these upwelling
areas accumulate at rates of 0.1–1.0 cm y
À1 and they
contain as much as 40% biogenic silica by weight.
The burial rate for silica in these areas can be as high
as 1.7 mol cm
À2 y
À1
. In calculating the total contribution of these areas to the overall marine silica
budget, the accumulation rates (calculated on an
areal basis) must be multiplied by the area covered
by the particular sedimentary regime. Because these
upwelling regimes are confined to such small areas,
the overall contribution of coastal upwelling sites to
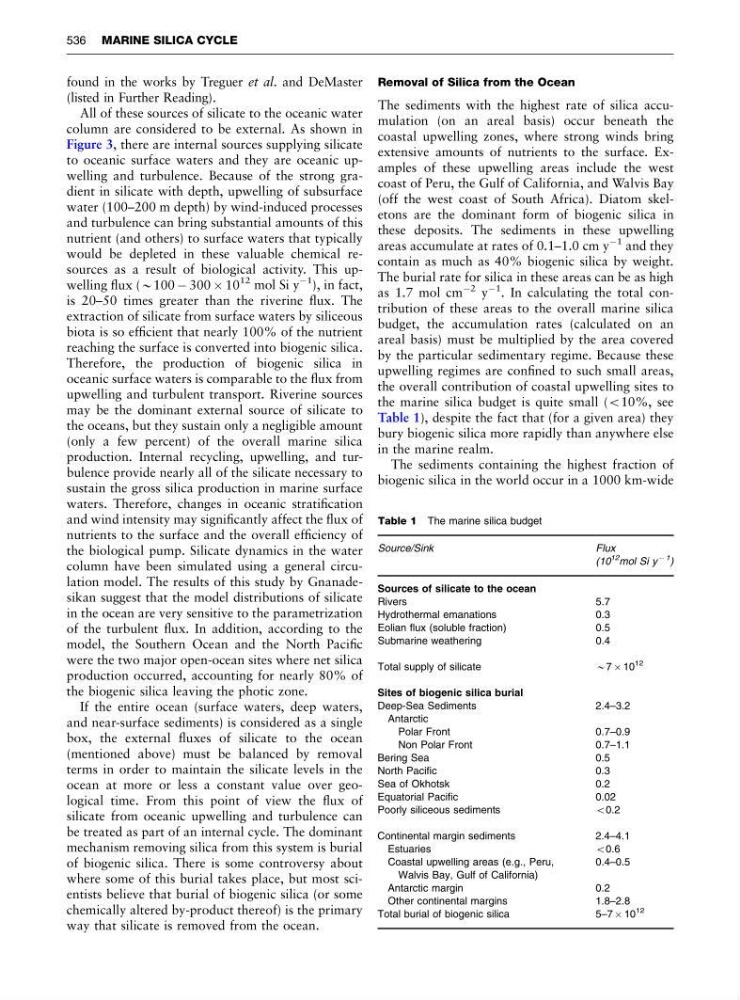
the marine silica budget is quite small (o10%, see
Table 1), despite the fact that (for a given area) they
bury biogenic silica more rapidly than anywhere else
in the marine realm.
The sediments containing the highest fraction of
biogenic silica in the world occur in a 1000 km-wide
Table 1 The marine silica budget
Source/Sink
Flux
(10
12 mol Si y
À 1 )
Sources of silicate to the ocean
Rivers
5.7
Hydrothermal emanations
0.3
Eolian flux (soluble fraction)
0.5
Submarine weathering
0.4
Total supply of silicate
B7 Â 10
12
Sites of biogenic silica burial
Deep-Sea Sediments
2.4–3.2
Antarctic
Polar Front
0.7–0.9
Non Polar Front
0.7–1.1
Bering Sea
0.5
North Pacific
0.3
Sea of Okhotsk
0.2
Equatorial Pacific
0.02
Poorly siliceous sediments
o0.2
Continental margin sediments
2.4–4.1
Estuaries
o0.6
Coastal upwelling areas (e.g., Peru,
Walvis Bay, Gulf of California)
0.4–0.5
Antarctic margin
0.2
Other continental margins
1.8–2.8
Total burial of biogenic silica
5–7 Â 10
12
536 MARINE SILICA CYCLE
(listed in Further Reading).
All of these sources of silicate to the oceanic water
column are considered to be external. As shown in
Figure 3, there are internal sources supplying silicate
to oceanic surface waters and they are oceanic upwelling and turbulence. Because of the strong gradient in silicate with depth, upwelling of subsurface
water (100–200 m depth) by wind-induced processes
and turbulence can bring substantial amounts of this
nutrient (and others) to surface waters that typically
would be depleted in these valuable chemical resources as a result of biological activity. This upwelling flux (B100 À 300 Â 10
12 mol Si y
À1 ), in fact,
is 20–50 times greater than the riverine flux. The
extraction of silicate from surface waters by siliceous
biota is so efficient that nearly 100% of the nutrient
reaching the surface is converted into biogenic silica.
Therefore, the production of biogenic silica in
oceanic surface waters is comparable to the flux from
upwelling and turbulent transport. Riverine sources
may be the dominant external source of silicate to
the oceans, but they sustain only a negligible amount
(only a few percent) of the overall marine silica
production. Internal recycling, upwelling, and turbulence provide nearly all of the silicate necessary to
sustain the gross silica production in marine surface
waters. Therefore, changes in oceanic stratification
and wind intensity may significantly affect the flux of
nutrients to the surface and the overall efficiency of
the biological pump. Silicate dynamics in the water
column have been simulated using a general circulation model. The results of this study by Gnanadesikan suggest that the model distributions of silicate
in the ocean are very sensitive to the parametrization
of the turbulent flux. In addition, according to the
model, the Southern Ocean and the North Pacific
were the two major open-ocean sites where net silica
production occurred, accounting for nearly 80% of
the biogenic silica leaving the photic zone.
If the entire ocean (surface waters, deep waters,
and near-surface sediments) is considered as a single
box, the external fluxes of silicate to the ocean
(mentioned above) must be balanced by removal
terms in order to maintain the silicate levels in the
ocean at more or less a constant value over geological time. From this point of view the flux of
silicate from oceanic upwelling and turbulence can
be treated as part of an internal cycle. The dominant
mechanism removing silica from this system is burial
of biogenic silica. There is some controversy about
where some of this burial takes place, but most scientists believe that burial of biogenic silica (or some
chemically altered by-product thereof) is the primary
way that silicate is removed from the ocean.
Removal of Silica from the Ocean
The sediments with the highest rate of silica accumulation (on an areal basis) occur beneath the
coastal upwelling zones, where strong winds bring
extensive amounts of nutrients to the surface. Examples of these upwelling areas include the west
coast of Peru, the Gulf of California, and Walvis Bay
(off the west coast of South Africa). Diatom skeletons are the dominant form of biogenic silica in
these deposits. The sediments in these upwelling
areas accumulate at rates of 0.1–1.0 cm y
À1 and they
contain as much as 40% biogenic silica by weight.
The burial rate for silica in these areas can be as high
as 1.7 mol cm
À2 y
À1
. In calculating the total contribution of these areas to the overall marine silica
budget, the accumulation rates (calculated on an
areal basis) must be multiplied by the area covered
by the particular sedimentary regime. Because these
upwelling regimes are confined to such small areas,
the overall contribution of coastal upwelling sites to
the marine silica budget is quite small (o10%, see
Table 1), despite the fact that (for a given area) they
bury biogenic silica more rapidly than anywhere else
in the marine realm.
The sediments containing the highest fraction of
biogenic silica in the world occur in a 1000 km-wide
Table 1 The marine silica budget
Source/Sink
Flux
(10
12 mol Si y
À 1 )
Sources of silicate to the ocean
Rivers
5.7
Hydrothermal emanations
0.3
Eolian flux (soluble fraction)
0.5
Submarine weathering
0.4
Total supply of silicate
B7 Â 10
12
Sites of biogenic silica burial
Deep-Sea Sediments
2.4–3.2
Antarctic
Polar Front
0.7–0.9
Non Polar Front
0.7–1.1
Bering Sea
0.5
North Pacific
0.3
Sea of Okhotsk
0.2
Equatorial Pacific
0.02
Poorly siliceous sediments
o0.2
Continental margin sediments
2.4–4.1
Estuaries
o0.6
Coastal upwelling areas (e.g., Peru,
Walvis Bay, Gulf of California)
0.4–0.5
Antarctic margin
0.2
Other continental margins
1.8–2.8
Total burial of biogenic silica
5–7 Â 10
12
536 MARINE SILICA CYCLE