

CENOZOIC OCEANS – CARBON CYCLE MODELS
L. Franc¸ ois and Y. Godde ´ ris, University of Lie ` ge,
Lie ` ge, Belgium
Copyright & 2001 Elsevier Ltd.
Introduction
The story of the Cenozoic is essentially a story of
global cooling. The last 65 million years of the
Earth’s history mark the transition from the Cretaceous ‘greenhouse’ climate toward the present-day
‘icehouse’ conditions. Particularly, the cooling by
about 8–101C of deep ocean waters since the Cretaceous was linked to a reorganization of the oceanic
circulation triggered by tectonic plate movements.
These oceanic circulation changes were coeval with
continental climatic change, as demonstrated by
abundant evidence for global cooling (pollen, faunal
assemblages, development of glaciers, etc.). For instance, most of western Europe and the western
United States had a subtropical climate during the
Eocene, despite the fact that they were located at the
same latitude as today. Another striking feature of
the changes that have occurred during Cenozoic
times is the decrease of the partial pressure of atmospheric CO 2 (PCO 2 ). Since CO 2 is a greenhouse
gas, there might be a causal relationship between the
decrease in PCO 2 and the general cooling trend of
Cenozoic climate. The global cooling might be the
result of the changes in oceanic circulation and atmospheric CO 2 , both probably influencing each
other and possibly initiated by tectonic processes.
Indicators of Atmospheric CO 2
Change
It should be kept in mind that there are no direct
proxies of ancient levels of CO 2 in the atmosphere.
Methods rely on three indirect indicators.
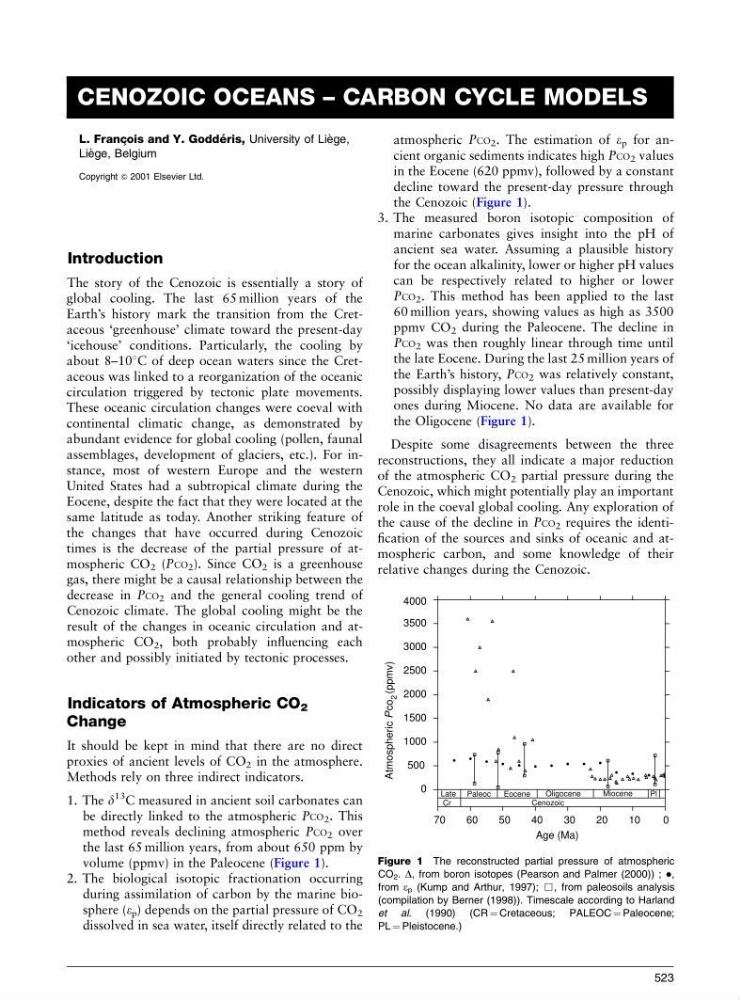
1. The d
13 C measured in ancient soil carbonates can
be directly linked to the atmospheric PCO 2 . This
method reveals declining atmospheric PCO 2 over
the last 65 million years, from about 650 ppm by
volume (ppmv) in the Paleocene (Figure 1).
2. The biological isotopic fractionation occurring
during assimilation of carbon by the marine biosphere (e p ) depends on the partial pressure of CO 2
dissolved in sea water, itself directly related to the
atmospheric PCO 2 . The estimation of e p for ancient organic sediments indicates high PCO 2 values
in the Eocene (620 ppmv), followed by a constant
decline toward the present-day pressure through
the Cenozoic (Figure 1).
3. The measured boron isotopic composition of
marine carbonates gives insight into the pH of
ancient sea water. Assuming a plausible history
for the ocean alkalinity, lower or higher pH values
can be respectively related to higher or lower
PCO 2 . This method has been applied to the last
60 million years, showing values as high as 3500
ppmv CO 2 during the Paleocene. The decline in
PCO 2 was then roughly linear through time until
the late Eocene. During the last 25 million years of
the Earth’s history, PCO 2 was relatively constant,
possibly displaying lower values than present-day
ones during Miocene. No data are available for
the Oligocene (Figure 1).
Despite some disagreements between the three
reconstructions, they all indicate a major reduction
of the atmospheric CO 2 partial pressure during the
Cenozoic, which might potentially play an important
role in the coeval global cooling. Any exploration of
the cause of the decline in PCO 2 requires the identification of the sources and sinks of oceanic and atmospheric carbon, and some knowledge of their
relative changes during the Cenozoic.
70
60
50
40
30
20
10
0
Age (Ma)
0
500
1000
1500
2000
2500
3000
3500
4000
Atmospheric
P co
2
(ppmv)
Pl
Miocene
Oligocene
Eocene
Paleoc
Late
Cr
Cenozoic
Figure 1 The reconstructed partial pressure of atmospheric
CO 2 . D, from boron isotopes (Pearson and Palmer (2000)) ; ,
from e p (Kump and Arthur, 1997); &, from paleosoils analysis
(compilation by Berner (1998)). Timescale according to Harland
et al. (1990) (CR ¼ Cretaceous; PALEOC ¼ Paleocene;
PL ¼ Pleistocene.)
523
L. Franc¸ ois and Y. Godde ´ ris, University of Lie ` ge,
Lie ` ge, Belgium
Copyright & 2001 Elsevier Ltd.
Introduction
The story of the Cenozoic is essentially a story of
global cooling. The last 65 million years of the
Earth’s history mark the transition from the Cretaceous ‘greenhouse’ climate toward the present-day
‘icehouse’ conditions. Particularly, the cooling by
about 8–101C of deep ocean waters since the Cretaceous was linked to a reorganization of the oceanic
circulation triggered by tectonic plate movements.
These oceanic circulation changes were coeval with
continental climatic change, as demonstrated by
abundant evidence for global cooling (pollen, faunal
assemblages, development of glaciers, etc.). For instance, most of western Europe and the western
United States had a subtropical climate during the
Eocene, despite the fact that they were located at the
same latitude as today. Another striking feature of
the changes that have occurred during Cenozoic
times is the decrease of the partial pressure of atmospheric CO 2 (PCO 2 ). Since CO 2 is a greenhouse
gas, there might be a causal relationship between the
decrease in PCO 2 and the general cooling trend of
Cenozoic climate. The global cooling might be the
result of the changes in oceanic circulation and atmospheric CO 2 , both probably influencing each
other and possibly initiated by tectonic processes.
Indicators of Atmospheric CO 2
Change
It should be kept in mind that there are no direct
proxies of ancient levels of CO 2 in the atmosphere.
Methods rely on three indirect indicators.
1. The d
13 C measured in ancient soil carbonates can
be directly linked to the atmospheric PCO 2 . This
method reveals declining atmospheric PCO 2 over
the last 65 million years, from about 650 ppm by
volume (ppmv) in the Paleocene (Figure 1).
2. The biological isotopic fractionation occurring
during assimilation of carbon by the marine biosphere (e p ) depends on the partial pressure of CO 2
dissolved in sea water, itself directly related to the
atmospheric PCO 2 . The estimation of e p for ancient organic sediments indicates high PCO 2 values
in the Eocene (620 ppmv), followed by a constant
decline toward the present-day pressure through
the Cenozoic (Figure 1).
3. The measured boron isotopic composition of
marine carbonates gives insight into the pH of
ancient sea water. Assuming a plausible history
for the ocean alkalinity, lower or higher pH values
can be respectively related to higher or lower
PCO 2 . This method has been applied to the last
60 million years, showing values as high as 3500
ppmv CO 2 during the Paleocene. The decline in
PCO 2 was then roughly linear through time until
the late Eocene. During the last 25 million years of
the Earth’s history, PCO 2 was relatively constant,
possibly displaying lower values than present-day
ones during Miocene. No data are available for
the Oligocene (Figure 1).
Despite some disagreements between the three
reconstructions, they all indicate a major reduction
of the atmospheric CO 2 partial pressure during the
Cenozoic, which might potentially play an important
role in the coeval global cooling. Any exploration of
the cause of the decline in PCO 2 requires the identification of the sources and sinks of oceanic and atmospheric carbon, and some knowledge of their
relative changes during the Cenozoic.
70
60
50
40
30
20
10
0
Age (Ma)
0
500
1000
1500
2000
2500
3000
3500
4000
Atmospheric
P co
2
(ppmv)
Pl
Miocene
Oligocene
Eocene
Paleoc
Late
Cr
Cenozoic
Figure 1 The reconstructed partial pressure of atmospheric
CO 2 . D, from boron isotopes (Pearson and Palmer (2000)) ; ,
from e p (Kump and Arthur, 1997); &, from paleosoils analysis
(compilation by Berner (1998)). Timescale according to Harland
et al. (1990) (CR ¼ Cretaceous; PALEOC ¼ Paleocene;
PL ¼ Pleistocene.)
523