

Nd concentrations in the surface water. Some of them
are based on filtered samples, using generally a 0.4–
1.0 mm membrane, of which results are called ‘dissolved’ concentrations. Many others, however, were
measured on unfiltered and acidified seawaters, and
hence can be ascribed to ‘acid-soluble total’ concentrations. The difference between the two is generally
small, less than 5% for all trivalent REEs in the open
oceans, even if the finer 0.04 mm membrane is used
for filtration (Table 2), and gross features of their
vertical profiles remain unchanged. Nevertheless,
when fine structures of the REE patterns are discussed, filtration becomes critical in changing the
pattern since the particulate fraction decreases from
B5% at the light and middle to less than 1% at the
heavy REEs. Furthermore, there is an obvious exception for Ce of which more than 35% is associated
with particles, being consistent with its 4 þ oxidation
state. Also, the REEs in unfiltered samples close to the
bottom often show anomalously high concentrations
due to resuspension of underlying sediments.
The vertical profiles of dissolved (o0.04 mm) REEs
for different oceanic basins are shown in Figure 3.
Except for Ce, all REEs show ‘nutrient-like’ gradual
increase with depth. There are small but systematic
differences in the profiles across the series, although
the North Atlantic profiles show somewhat complex
features dominated by horizontal advection of different water masses (from the above, the Sargasso
Sea Surface Water, the North Atlantic Deep Water,
and the Antarctic Bottom Water). For instance, in the
Southern Ocean and the North Pacific, the light and
middle REEs (e.g. Pr-Gd) almost linearly increase
with depth, whereas the heavy REEs (e.g. Ho-Lu)
and Y show convex features. The concentrations of
the heavy REEs below 1500 m are in the order of
North AtlanticoSouthern OceanoNorth Pacific
much like those of nutrients, whereas those of the
light REEs are Southern OceanoNorth AtlanticoNorth Pacific, presumably reflected by scavenging
intensities in those regions. Although the vertical
profiles of the REEs are similar to those of nutrients,
e.g. dissolved silica, there is a difference in that the
REE concentrations never approach zero in the surface water like nutrients in the temperate oligotrophic zone. Analysis of interelement correlations
indicate that the heavy REEs and Y better correlate
with dissolved silica and alkalinity than with nitrate
and phosphate. Within the REEs, the best correlations (R
2
40.99) can be found between neighboring
trivalent REEs, and between Y and the heavy REEs.
As a trivalent REE pair is apart in their atomic
number, the correlation between the two becomes
worse. Lanthanum often deviates in these general
trends from the light REEs toward the heavy REEs.
The vertical profiles of Ce is unique among the
REEs showing a decrease from the high concentrations in the surface waters to the low and nearly
constant values in the deep waters (Figure 3). Such a
distribution pattern can be seen for other leastsoluble-elements, such as Al, Co, and Bi which
also hydrolyze readily. The different profiles among
the basins may be governed by the balance in the
strength of external inputs (eolian þ riverine) to the
surface ocean and particle scavenging throughout
the water column.
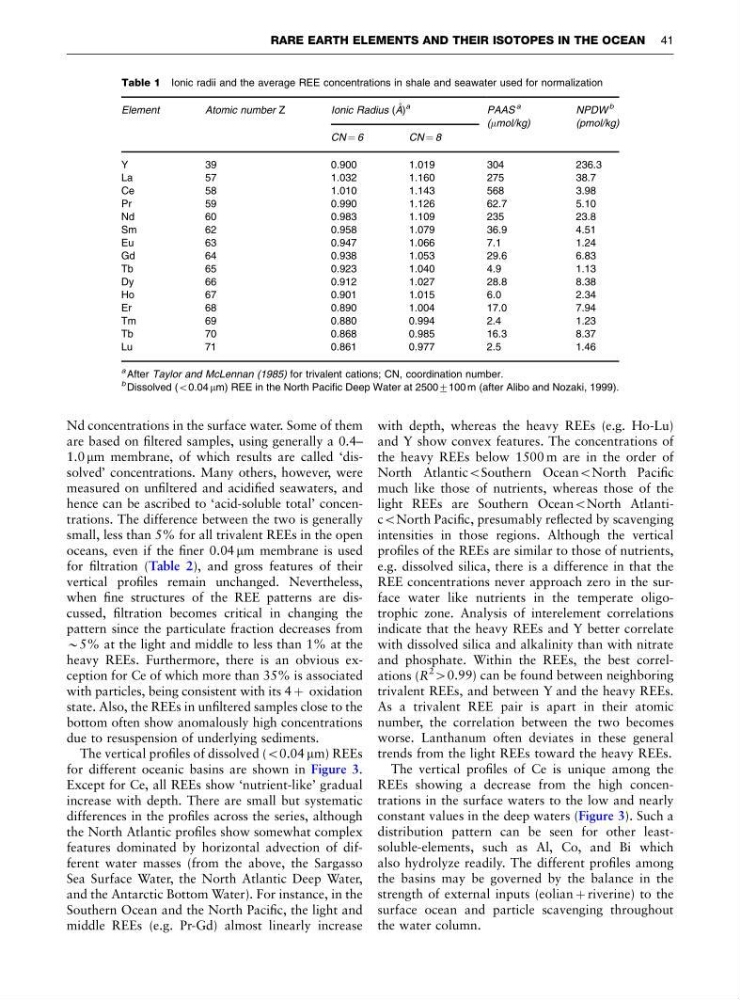
Table 1 Ionic radii and the average REE concentrations in shale and seawater used for normalization
Element
Atomic number Z
Ionic Radius (A ˚ )
a
PAAS
a
(mmol/kg)
NPDW
b
(pmol/kg)
CN ¼ 6
C N ¼ 8
Y
39
0.900
1.019
304
236.3
La
57
1.032
1.160
275
38.7
Ce
58
1.010
1.143
568
3.98
Pr
59
0.990
1.126
62.7
5.10
Nd
60
0.983
1.109
235
23.8
Sm
62
0.958
1.079
36.9
4.51
Eu
63
0.947
1.066
7.1
1.24
Gd
64
0.938
1.053
29.6
6.83
Tb
65
0.923
1.040
4.9
1.13
Dy
66
0.912
1.027
28.8
8.38
Ho
67
0.901
1.015
6.0
2.34
Er
68
0.890
1.004
17.0
7.94
Tm
69
0.880
0.994
2.4
1.23
Tb
70
0.868
0.985
16.3
8.37
Lu
71
0.861
0.977
2.5
1.46
a After Taylor and McLennan (1985) for trivalent cations; CN, coordination number.
b Dissolved (o0.04 mm) REE in the North Pacific Deep Water at 25007100 m (after Alibo and Nozaki, 1999).
RARE EARTH ELEMENTS AND THEIR ISOTOPES IN THE OCEAN 41
are based on filtered samples, using generally a 0.4–
1.0 mm membrane, of which results are called ‘dissolved’ concentrations. Many others, however, were
measured on unfiltered and acidified seawaters, and
hence can be ascribed to ‘acid-soluble total’ concentrations. The difference between the two is generally
small, less than 5% for all trivalent REEs in the open
oceans, even if the finer 0.04 mm membrane is used
for filtration (Table 2), and gross features of their
vertical profiles remain unchanged. Nevertheless,
when fine structures of the REE patterns are discussed, filtration becomes critical in changing the
pattern since the particulate fraction decreases from
B5% at the light and middle to less than 1% at the
heavy REEs. Furthermore, there is an obvious exception for Ce of which more than 35% is associated
with particles, being consistent with its 4 þ oxidation
state. Also, the REEs in unfiltered samples close to the
bottom often show anomalously high concentrations
due to resuspension of underlying sediments.
The vertical profiles of dissolved (o0.04 mm) REEs
for different oceanic basins are shown in Figure 3.
Except for Ce, all REEs show ‘nutrient-like’ gradual
increase with depth. There are small but systematic
differences in the profiles across the series, although
the North Atlantic profiles show somewhat complex
features dominated by horizontal advection of different water masses (from the above, the Sargasso
Sea Surface Water, the North Atlantic Deep Water,
and the Antarctic Bottom Water). For instance, in the
Southern Ocean and the North Pacific, the light and
middle REEs (e.g. Pr-Gd) almost linearly increase
with depth, whereas the heavy REEs (e.g. Ho-Lu)
and Y show convex features. The concentrations of
the heavy REEs below 1500 m are in the order of
North AtlanticoSouthern OceanoNorth Pacific
much like those of nutrients, whereas those of the
light REEs are Southern OceanoNorth AtlanticoNorth Pacific, presumably reflected by scavenging
intensities in those regions. Although the vertical
profiles of the REEs are similar to those of nutrients,
e.g. dissolved silica, there is a difference in that the
REE concentrations never approach zero in the surface water like nutrients in the temperate oligotrophic zone. Analysis of interelement correlations
indicate that the heavy REEs and Y better correlate
with dissolved silica and alkalinity than with nitrate
and phosphate. Within the REEs, the best correlations (R
2
40.99) can be found between neighboring
trivalent REEs, and between Y and the heavy REEs.
As a trivalent REE pair is apart in their atomic
number, the correlation between the two becomes
worse. Lanthanum often deviates in these general
trends from the light REEs toward the heavy REEs.
The vertical profiles of Ce is unique among the
REEs showing a decrease from the high concentrations in the surface waters to the low and nearly
constant values in the deep waters (Figure 3). Such a
distribution pattern can be seen for other leastsoluble-elements, such as Al, Co, and Bi which
also hydrolyze readily. The different profiles among
the basins may be governed by the balance in the
strength of external inputs (eolian þ riverine) to the
surface ocean and particle scavenging throughout
the water column.
Table 1 Ionic radii and the average REE concentrations in shale and seawater used for normalization
Element
Atomic number Z
Ionic Radius (A ˚ )
a
PAAS
a
(mmol/kg)
NPDW
b
(pmol/kg)
CN ¼ 6
C N ¼ 8
Y
39
0.900
1.019
304
236.3
La
57
1.032
1.160
275
38.7
Ce
58
1.010
1.143
568
3.98
Pr
59
0.990
1.126
62.7
5.10
Nd
60
0.983
1.109
235
23.8
Sm
62
0.958
1.079
36.9
4.51
Eu
63
0.947
1.066
7.1
1.24
Gd
64
0.938
1.053
29.6
6.83
Tb
65
0.923
1.040
4.9
1.13
Dy
66
0.912
1.027
28.8
8.38
Ho
67
0.901
1.015
6.0
2.34
Er
68
0.890
1.004
17.0
7.94
Tm
69
0.880
0.994
2.4
1.23
Tb
70
0.868
0.985
16.3
8.37
Lu
71
0.861
0.977
2.5
1.46
a After Taylor and McLennan (1985) for trivalent cations; CN, coordination number.
b Dissolved (o0.04 mm) REE in the North Pacific Deep Water at 25007100 m (after Alibo and Nozaki, 1999).
RARE EARTH ELEMENTS AND THEIR ISOTOPES IN THE OCEAN 41