

0˚
0˚
20˚
20˚
40˚
40˚
60˚
60˚
80˚
80˚
100˚
100˚
120˚
120˚
140˚
140˚
160˚
160˚
180˚
180˚
160˚
160˚
140˚
140˚
120˚
120˚
100˚
100˚
80˚
80˚
60˚
60˚
40˚
40˚
20˚
20˚
0˚
0˚
80˚
80˚
70˚
70˚
60˚
60˚
50˚
50˚
40˚
40˚
30˚
30˚
20˚
20˚
10˚
10˚
0˚
0˚
10˚
10˚
20˚
20˚
30˚
30˚
40˚
40˚
50˚
50˚
60˚
60˚
70˚
70˚
80˚
80˚
_ 150 _ 135 _ 120 _ 105 _ 90 _ 75 _ 60 _ 45 _ 30 _ 15 0
15 30
45 60
75 90 105 120 135
Seawater _ Air pCO 2 (μatm)
GMT 09:16 Apr 04 2000
GMT
GMT 09:16 Apr 04 2000
0˚
0˚
20˚
20˚
40˚
40˚
60˚
60˚
80˚
80˚
100˚
100˚
120˚
120˚
140˚
140˚
160˚
160˚
180˚
180˚
160˚
160˚
140˚
140˚
120˚
120˚
100˚
100˚
80˚
80˚
60˚
60˚
40˚
40˚
20˚
20˚
0˚
0˚
80˚
80˚
70˚
70˚
60˚
60˚
50˚
50˚
40˚
40˚
30˚
30˚
20˚
20˚
10˚
10˚
0˚
0˚
10˚
10˚
20˚
20˚
30˚
30˚
40˚
40˚
50˚
50˚
60˚
60˚
70˚
70˚
80˚
80˚
_ 150 _ 135 _ 120 _ 105 _ 90 _ 75 _ 60 _ 45 _ 30 _ 15 0
15 30
45 60
75 90 105 120 135
Seawater _ Air pCO 2 (μatm)
GMT
(A)
(B)
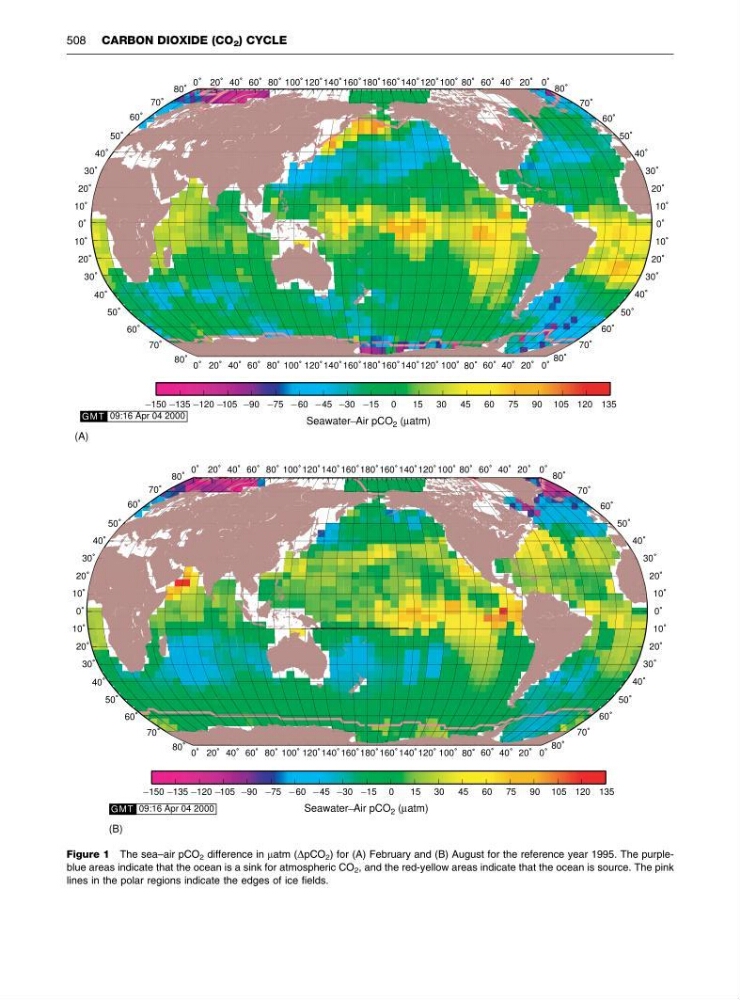
Figure 1 The sea–air pCO 2 difference in matm (DpCO 2 ) for (A) February and (B) August for the reference year 1995. The purpleblue areas indicate that the ocean is a sink for atmospheric CO 2 , and the red-yellow areas indicate that the ocean is source. The pink
lines in the polar regions indicate the edges of ice fields.
508 CARBON DIOXIDE (CO 2 ) CYCLE
0˚
20˚
20˚
40˚
40˚
60˚
60˚
80˚
80˚
100˚
100˚
120˚
120˚
140˚
140˚
160˚
160˚
180˚
180˚
160˚
160˚
140˚
140˚
120˚
120˚
100˚
100˚
80˚
80˚
60˚
60˚
40˚
40˚
20˚
20˚
0˚
0˚
80˚
80˚
70˚
70˚
60˚
60˚
50˚
50˚
40˚
40˚
30˚
30˚
20˚
20˚
10˚
10˚
0˚
0˚
10˚
10˚
20˚
20˚
30˚
30˚
40˚
40˚
50˚
50˚
60˚
60˚
70˚
70˚
80˚
80˚
_ 150 _ 135 _ 120 _ 105 _ 90 _ 75 _ 60 _ 45 _ 30 _ 15 0
15 30
45 60
75 90 105 120 135
Seawater _ Air pCO 2 (μatm)
GMT 09:16 Apr 04 2000
GMT
GMT 09:16 Apr 04 2000
0˚
0˚
20˚
20˚
40˚
40˚
60˚
60˚
80˚
80˚
100˚
100˚
120˚
120˚
140˚
140˚
160˚
160˚
180˚
180˚
160˚
160˚
140˚
140˚
120˚
120˚
100˚
100˚
80˚
80˚
60˚
60˚
40˚
40˚
20˚
20˚
0˚
0˚
80˚
80˚
70˚
70˚
60˚
60˚
50˚
50˚
40˚
40˚
30˚
30˚
20˚
20˚
10˚
10˚
0˚
0˚
10˚
10˚
20˚
20˚
30˚
30˚
40˚
40˚
50˚
50˚
60˚
60˚
70˚
70˚
80˚
80˚
_ 150 _ 135 _ 120 _ 105 _ 90 _ 75 _ 60 _ 45 _ 30 _ 15 0
15 30
45 60
75 90 105 120 135
Seawater _ Air pCO 2 (μatm)
GMT
(A)
(B)
Figure 1 The sea–air pCO 2 difference in matm (DpCO 2 ) for (A) February and (B) August for the reference year 1995. The purpleblue areas indicate that the ocean is a sink for atmospheric CO 2 , and the red-yellow areas indicate that the ocean is source. The pink
lines in the polar regions indicate the edges of ice fields.
508 CARBON DIOXIDE (CO 2 ) CYCLE