

zone is most widespread, persistent, and severe in
June, July, and August, and often well into September,
depending on whether tropical storm activity begins
to disrupt the stratification and hypoxia. Anoxic
waters occur periodically in midsummer.
The midsummer size of the hypoxic zone varies
annually, and is most closely related to the nitrate
load of the Mississippi River in the 2 months prior to
the typically late-July mapping exercise. The load of
nitrate is determined by the discharge of the Mississippi River multiplied by the concentration of the
nitrate, so that the amount of water coming into the
Gulf of Mexico is also a factor. The relationship of
the size of hypoxia, however, is stronger with the
load of nitrate than with the total river water discharge or any other nutrient or combination of
nutrients. Changes in the severity of hypoxia over
time are related mostly to the change in nitrate
concentration in the Mississippi River (80%), the
remainder to changes in increased discharge (20%).
Historical Change in Oxygen
Conditions
Historical dissolved oxygen data such as those for
the northern Adriatic Sea beginning in 1911 are not
commonly available. A solution is to turn to the
sediment record for paleoindicators of long-term
transitions related to eutrophication and oxygen
deficiency. Biological, mineral, or chemical indicators of plant communities, level of productivity, or
0
5
10
15
20
25
30
35
40
45
55
−30
−25
−20
−15
−10
−5
Depth (m)
−30
−25
−20
−15
−10
−5
Depth (m)
Distance (km)
50
0
5
10
15
20
25
30
35
40
45
55
50
8/16/1990
9/17/1990
7
6
5
1
1
1
2
4 3
7 6
6
6
6
6
7
6
5
5
1
2
3
4
5
5
4
3
2
2
2
1
1
3
2
2 3
4
1
3
4 5
1
3
4
2
4
6
6
7
8
7 6 5
4 3
3
2
2
6
6
6
7
7
5
5
5
5
5
4
5
5
5
5
4
5
4
3
4
4
3
3
2
1
1
2
3
3
4
4
4
3
2
2
1
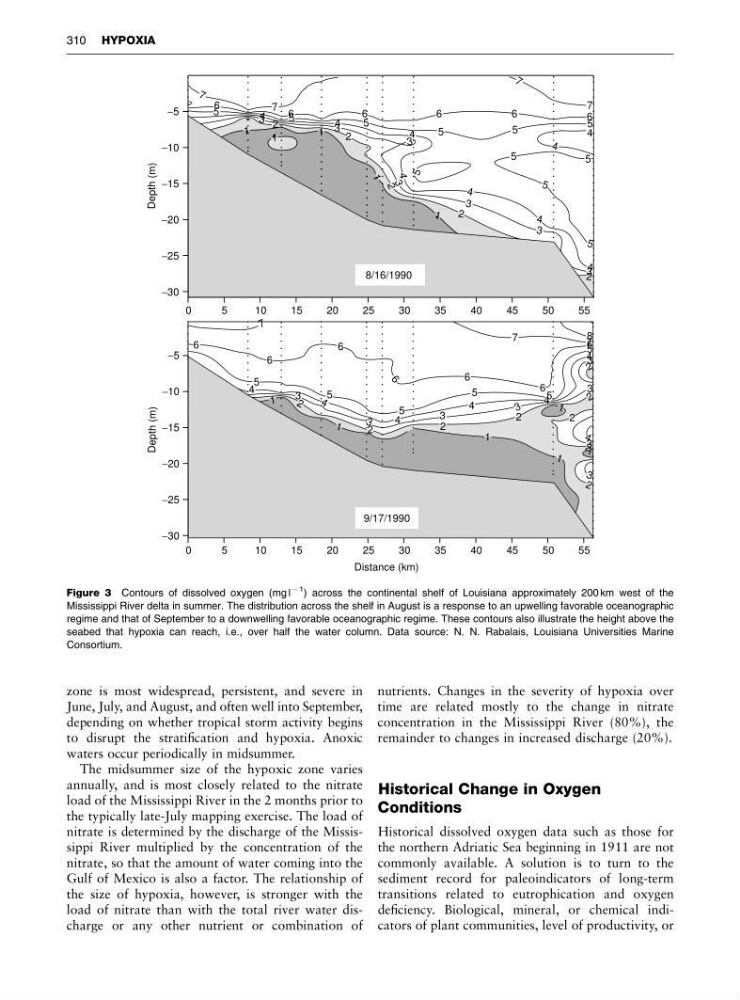
Figure 3 Contours of dissolved oxygen (mg l
À 1
) across the continental shelf of Louisiana approximately 200 km west of the
Mississippi River delta in summer. The distribution across the shelf in August is a response to an upwelling favorable oceanographic
regime and that of September to a downwelling favorable oceanographic regime. These contours also illustrate the height above the
seabed that hypoxia can reach, i.e., over half the water column. Data source: N. N. Rabalais, Louisiana Universities Marine
Consortium.
310 HYPOXIA
June, July, and August, and often well into September,
depending on whether tropical storm activity begins
to disrupt the stratification and hypoxia. Anoxic
waters occur periodically in midsummer.
The midsummer size of the hypoxic zone varies
annually, and is most closely related to the nitrate
load of the Mississippi River in the 2 months prior to
the typically late-July mapping exercise. The load of
nitrate is determined by the discharge of the Mississippi River multiplied by the concentration of the
nitrate, so that the amount of water coming into the
Gulf of Mexico is also a factor. The relationship of
the size of hypoxia, however, is stronger with the
load of nitrate than with the total river water discharge or any other nutrient or combination of
nutrients. Changes in the severity of hypoxia over
time are related mostly to the change in nitrate
concentration in the Mississippi River (80%), the
remainder to changes in increased discharge (20%).
Historical Change in Oxygen
Conditions
Historical dissolved oxygen data such as those for
the northern Adriatic Sea beginning in 1911 are not
commonly available. A solution is to turn to the
sediment record for paleoindicators of long-term
transitions related to eutrophication and oxygen
deficiency. Biological, mineral, or chemical indicators of plant communities, level of productivity, or
0
5
10
15
20
25
30
35
40
45
55
−30
−25
−20
−15
−10
−5
Depth (m)
−30
−25
−20
−15
−10
−5
Depth (m)
Distance (km)
50
0
5
10
15
20
25
30
35
40
45
55
50
8/16/1990
9/17/1990
7
6
5
1
1
1
2
4 3
7 6
6
6
6
6
7
6
5
5
1
2
3
4
5
5
4
3
2
2
2
1
1
3
2
2 3
4
1
3
4 5
1
3
4
2
4
6
6
7
8
7 6 5
4 3
3
2
2
6
6
6
7
7
5
5
5
5
5
4
5
5
5
5
4
5
4
3
4
4
3
3
2
1
1
2
3
3
4
4
4
3
2
2
1
Figure 3 Contours of dissolved oxygen (mg l
À 1
) across the continental shelf of Louisiana approximately 200 km west of the
Mississippi River delta in summer. The distribution across the shelf in August is a response to an upwelling favorable oceanographic
regime and that of September to a downwelling favorable oceanographic regime. These contours also illustrate the height above the
seabed that hypoxia can reach, i.e., over half the water column. Data source: N. N. Rabalais, Louisiana Universities Marine
Consortium.
310 HYPOXIA