

the true half-life of
14 C is 5730 years, and this true
value should be used when making decay-related
corrections in geochemical systems.
14 C Distribution in the Geosphere
Natural Processes
Atmospheric
14
CO 2 is distributed rapidly throughout
the terrestrial biosphere, and living plants and their
heterotrophic consumers (animals) are in equilibrium
with the D
14 C value of the atmosphere. Thus, in
radiocarbon dating, the
14
C concentration of a sample
is strictly an indicator of the amount of time that has
passed since the death of the terrestrial primary producer. When an organism assimilates a fraction of preaged carbon, an appropriate ‘reservoir age’ D
14 C ;
must be subtracted to correct for the deviation of this
material from the age of the atmosphere. Therefore,
reservoir time must be considered when interpreting
the
14
C ‘ages’ D
14 C ; of all of the global organic carbon pools other than the land biota.
For example, continuous vertical mixing of the
ocean provides the surface waters with some abyssal
DIC that has been removed from contact with atmospheric CO 2 for up to 1500 years. This process
gives the ocean an average surface water reservoir
age of about 400 years (D
14 C ¼ À 50 ppt). A constant correction factor of 400 years often is subtracted from the radiocarbon dates of marine
materials (both organic and inorganic). There are
regional differences, however, and in upwelling areas
the true deviation can approach 1300 years.
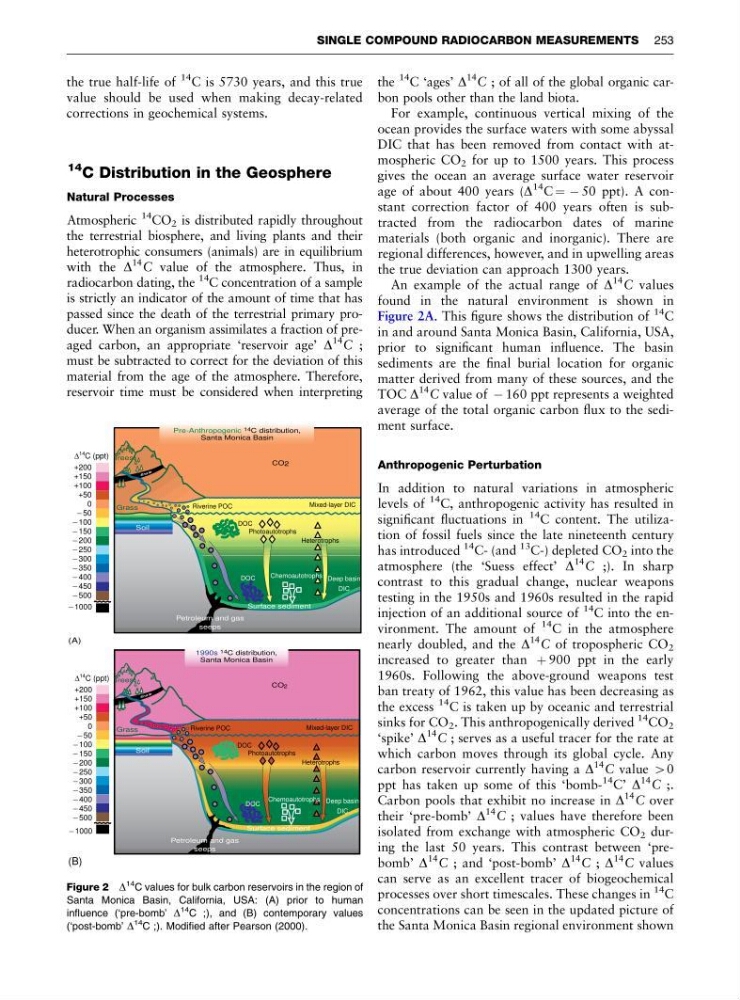
An example of the actual range of D
14 C values
found in the natural environment is shown in
Figure 2A. This figure shows the distribution of
14
C
in and around Santa Monica Basin, California, USA,
prior to significant human influence. The basin
sediments are the final burial location for organic
matter derived from many of these sources, and the
TOC D
14 C value of À 160 ppt represents a weighted
average of the total organic carbon flux to the sediment surface.
Anthropogenic Perturbation
In addition to natural variations in atmospheric
levels of
14 C, anthropogenic activity has resulted in
significant fluctuations in
14 C content. The utilization of fossil fuels since the late nineteenth century
has introduced
14 C- (and
13
C-) depleted CO 2 into the
atmosphere (the ‘Suess effect’ D
14 C ;). In sharp
contrast to this gradual change, nuclear weapons
testing in the 1950s and 1960s resulted in the rapid
injection of an additional source of
14
C into the environment. The amount of
14
C in the atmosphere
nearly doubled, and the D
14 C of tropospheric CO 2
increased to greater than þ 900 ppt in the early
1960s. Following the above-ground weapons test
ban treaty of 1962, this value has been decreasing as
the excess
14 C is taken up by oceanic and terrestrial
sinks for CO 2 . This anthropogenically derived
14 CO 2
‘spike’ D
14 C ; serves as a useful tracer for the rate at
which carbon moves through its global cycle. Any
carbon reservoir currently having a D
14 C value 40
ppt has taken up some of this ‘bomb14 C’ D
14 C ;.
Carbon pools that exhibit no increase in D
14 C over
their ‘pre-bomb’ D
14 C ; values have therefore been
isolated from exchange with atmospheric CO 2 during the last 50 years. This contrast between ‘prebomb’ D
14 C ; and ‘post-bomb’ D
14 C ; D
14 C values
can serve as an excellent tracer of biogeochemical
processes over short timescales. These changes in
14
C
concentrations can be seen in the updated picture of
the Santa Monica Basin regional environment shown
Surface sediment
Petroleum and gas
seeps
Trees
Grass
CO2
Soil
Riverine POC
DOC
DOC
Photoautotrophs
Mixed-layer DIC
Deep basin
DIC
Heterotrophs
Chemoautotrophs
+200
+150
+100
+50
0
_ 50
_ 100
_ 150
_ 200
_ 250
_ 300
_ 350
_ 400
_ 450
_ 500
_ 1000
Pre-Anthropogenic 14 C distribution,
Santa Monica Basin
Δ
14 C (ppt)
(A)
Surface sediment
Trees
Grass
CO2
Soil
Riverine POC
DOC
DOC
Photoautotrophs
Mixed-layer DIC
Deep basin
DIC
Heterotrophs
Chemoautotrophs
Petroleum and gas
seeps
1990s 14 C distribution,
Santa Monica Basin
+200
+150
+100
+50
0
_ 50
_ 100
_ 150
_ 200
_ 250
_ 300
_ 350
_ 400
_ 450
_ 500
_ 1000
Δ
14 C (ppt)
(B)
Figure 2 D
14 C values for bulk carbon reservoirs in the region of
Santa Monica Basin, California, USA: (A) prior to human
influence (‘pre-bomb’ D
14 C ;), and (B) contemporary values
(‘post-bomb’ D
14 C ;). Modified after Pearson (2000).
SINGLE COMPOUND RADIOCARBON MEASUREMENTS 253
14 C is 5730 years, and this true
value should be used when making decay-related
corrections in geochemical systems.
14 C Distribution in the Geosphere
Natural Processes
Atmospheric
14
CO 2 is distributed rapidly throughout
the terrestrial biosphere, and living plants and their
heterotrophic consumers (animals) are in equilibrium
with the D
14 C value of the atmosphere. Thus, in
radiocarbon dating, the
14
C concentration of a sample
is strictly an indicator of the amount of time that has
passed since the death of the terrestrial primary producer. When an organism assimilates a fraction of preaged carbon, an appropriate ‘reservoir age’ D
14 C ;
must be subtracted to correct for the deviation of this
material from the age of the atmosphere. Therefore,
reservoir time must be considered when interpreting
the
14
C ‘ages’ D
14 C ; of all of the global organic carbon pools other than the land biota.
For example, continuous vertical mixing of the
ocean provides the surface waters with some abyssal
DIC that has been removed from contact with atmospheric CO 2 for up to 1500 years. This process
gives the ocean an average surface water reservoir
age of about 400 years (D
14 C ¼ À 50 ppt). A constant correction factor of 400 years often is subtracted from the radiocarbon dates of marine
materials (both organic and inorganic). There are
regional differences, however, and in upwelling areas
the true deviation can approach 1300 years.
An example of the actual range of D
14 C values
found in the natural environment is shown in
Figure 2A. This figure shows the distribution of
14
C
in and around Santa Monica Basin, California, USA,
prior to significant human influence. The basin
sediments are the final burial location for organic
matter derived from many of these sources, and the
TOC D
14 C value of À 160 ppt represents a weighted
average of the total organic carbon flux to the sediment surface.
Anthropogenic Perturbation
In addition to natural variations in atmospheric
levels of
14 C, anthropogenic activity has resulted in
significant fluctuations in
14 C content. The utilization of fossil fuels since the late nineteenth century
has introduced
14 C- (and
13
C-) depleted CO 2 into the
atmosphere (the ‘Suess effect’ D
14 C ;). In sharp
contrast to this gradual change, nuclear weapons
testing in the 1950s and 1960s resulted in the rapid
injection of an additional source of
14
C into the environment. The amount of
14
C in the atmosphere
nearly doubled, and the D
14 C of tropospheric CO 2
increased to greater than þ 900 ppt in the early
1960s. Following the above-ground weapons test
ban treaty of 1962, this value has been decreasing as
the excess
14 C is taken up by oceanic and terrestrial
sinks for CO 2 . This anthropogenically derived
14 CO 2
‘spike’ D
14 C ; serves as a useful tracer for the rate at
which carbon moves through its global cycle. Any
carbon reservoir currently having a D
14 C value 40
ppt has taken up some of this ‘bomb14 C’ D
14 C ;.
Carbon pools that exhibit no increase in D
14 C over
their ‘pre-bomb’ D
14 C ; values have therefore been
isolated from exchange with atmospheric CO 2 during the last 50 years. This contrast between ‘prebomb’ D
14 C ; and ‘post-bomb’ D
14 C ; D
14 C values
can serve as an excellent tracer of biogeochemical
processes over short timescales. These changes in
14
C
concentrations can be seen in the updated picture of
the Santa Monica Basin regional environment shown
Surface sediment
Petroleum and gas
seeps
Trees
Grass
CO2
Soil
Riverine POC
DOC
DOC
Photoautotrophs
Mixed-layer DIC
Deep basin
DIC
Heterotrophs
Chemoautotrophs
+200
+150
+100
+50
0
_ 50
_ 100
_ 150
_ 200
_ 250
_ 300
_ 350
_ 400
_ 450
_ 500
_ 1000
Pre-Anthropogenic 14 C distribution,
Santa Monica Basin
Δ
14 C (ppt)
(A)
Surface sediment
Trees
Grass
CO2
Soil
Riverine POC
DOC
DOC
Photoautotrophs
Mixed-layer DIC
Deep basin
DIC
Heterotrophs
Chemoautotrophs
Petroleum and gas
seeps
1990s 14 C distribution,
Santa Monica Basin
+200
+150
+100
+50
0
_ 50
_ 100
_ 150
_ 200
_ 250
_ 300
_ 350
_ 400
_ 450
_ 500
_ 1000
Δ
14 C (ppt)
(B)
Figure 2 D
14 C values for bulk carbon reservoirs in the region of
Santa Monica Basin, California, USA: (A) prior to human
influence (‘pre-bomb’ D
14 C ;), and (B) contemporary values
(‘post-bomb’ D
14 C ;). Modified after Pearson (2000).
SINGLE COMPOUND RADIOCARBON MEASUREMENTS 253