

60° N
30° N
30° S
180°W
9 0 °W
9 0 °E
0°
60° S
2 0 0
EQ
200
1 0 0
0
5 5
150
2 0 0
1 5 5
Ocean data view
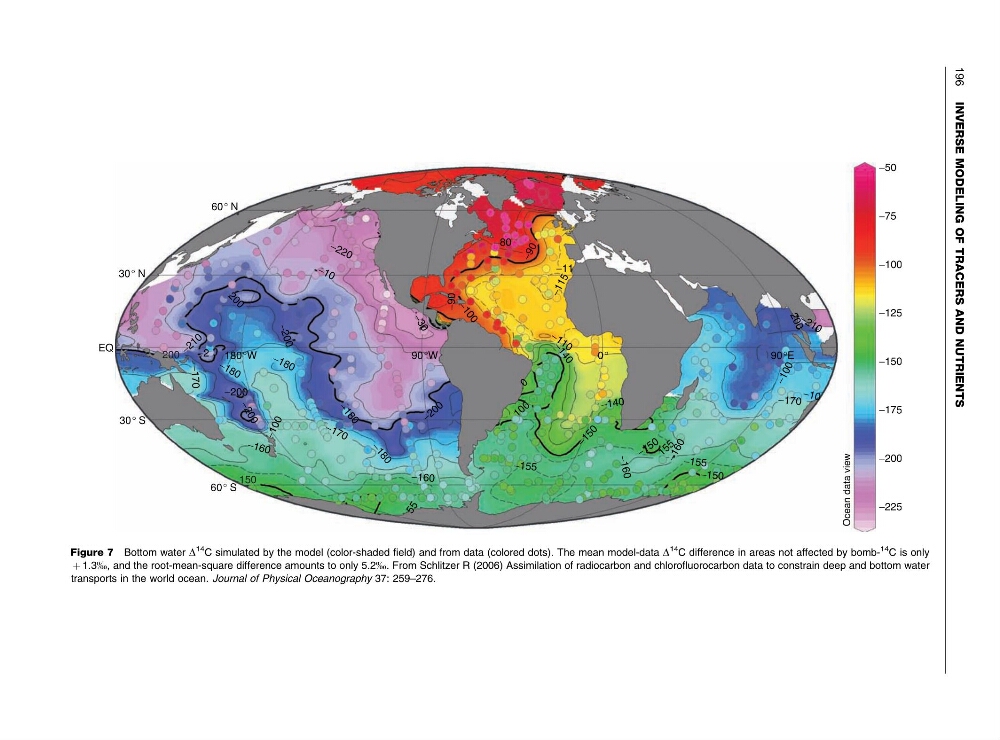
Figure 7 Bottom water D
14 C simulated by the model (color-shaded field) and from data (colored dots). The mean model-data D
14
C difference in areas not affected by bomb14 C is only
þ 1.3%, and the root-mean-square difference amounts to only 5.2%. From Schlitzer R (2006) Assimilation of radiocarbon and chlorofluorocarbon data to constrain deep and bottom water
transports in the world ocean. Journal of Physical Oceanography 37: 259–276.
196 INVERSE MODELING OF TRACERS AND NUTRIENTS
30° N
30° S
180°W
9 0 °W
9 0 °E
0°
60° S
2 0 0
EQ
200
1 0 0
0
5 5
150
2 0 0
1 5 5
Ocean data view
Figure 7 Bottom water D
14 C simulated by the model (color-shaded field) and from data (colored dots). The mean model-data D
14
C difference in areas not affected by bomb14 C is only
þ 1.3%, and the root-mean-square difference amounts to only 5.2%. From Schlitzer R (2006) Assimilation of radiocarbon and chlorofluorocarbon data to constrain deep and bottom water
transports in the world ocean. Journal of Physical Oceanography 37: 259–276.
196 INVERSE MODELING OF TRACERS AND NUTRIENTS