

manufacture and use. The exceptions where concentrations remained elevated were generally in
ecosystems with a significant burden of DDT or PCBs
in surface sediments as a result of past inputs.
The trends in DDT and PCB concentrations, and
two other chlorinated hydrocarbon pesticides,
chlordane and dieldrin, in bivalve tissues at locations
in the US coastal area for 1986 to 1995 are summarized in Table 2. The decrease noted from limited
sampling for a few areas in the 1970s and early
1980s continues for some locations. For many other
locations, examination of the data indicates that the
concentrations are so low that general global and
regional biogeochemical cycles are causing only a
slow further decrease. A few stations continue to
maintain elevated concentrations and for most this
can be attributed to continuing contamination of the
bivalves from nearby surface sediments containing
high concentrations of the compounds.
Similar types of ‘Mussel or Oyster Watch’ data
have been collected in some European countries (e.g.,
France) with similar results. Prototypes of this
approach have been carried out in the 1990s for
developing countries of Central and South America
and South-east Asia under the auspices of UNESCOIOC and UNEP. Other time trends of DDT and PCB
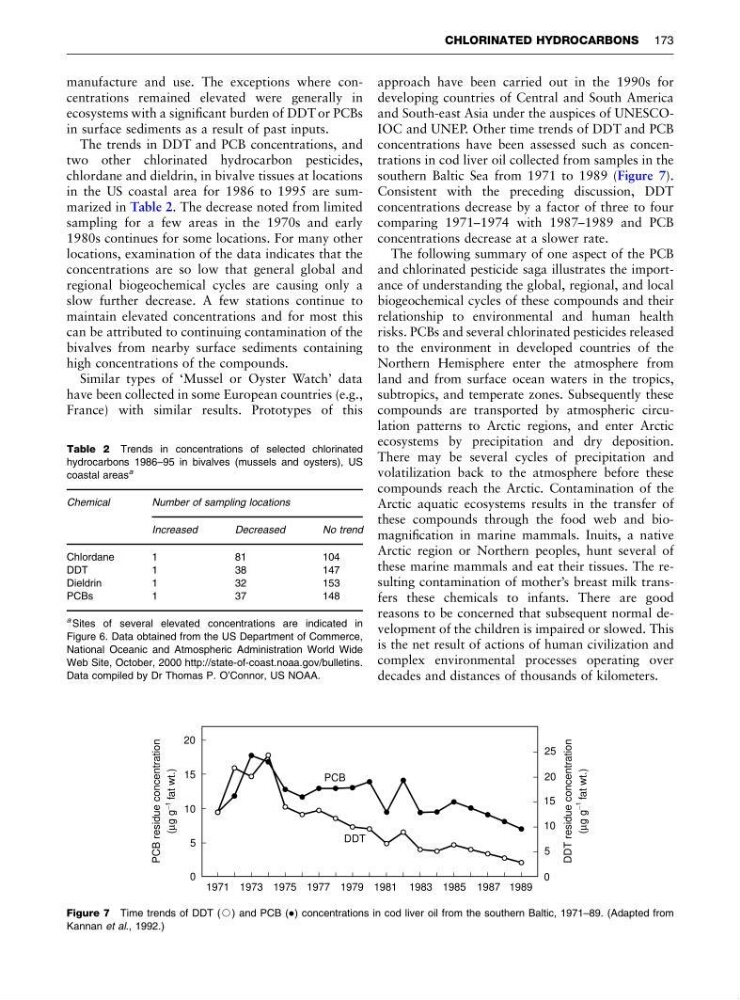
concentrations have been assessed such as concentrations in cod liver oil collected from samples in the
southern Baltic Sea from 1971 to 1989 (Figure 7).
Consistent with the preceding discussion, DDT
concentrations decrease by a factor of three to four
comparing 1971–1974 with 1987–1989 and PCB
concentrations decrease at a slower rate.
The following summary of one aspect of the PCB
and chlorinated pesticide saga illustrates the importance of understanding the global, regional, and local
biogeochemical cycles of these compounds and their
relationship to environmental and human health
risks. PCBs and several chlorinated pesticides released
to the environment in developed countries of the
Northern Hemisphere enter the atmosphere from
land and from surface ocean waters in the tropics,
subtropics, and temperate zones. Subsequently these
compounds are transported by atmospheric circulation patterns to Arctic regions, and enter Arctic
ecosystems by precipitation and dry deposition.
There may be several cycles of precipitation and
volatilization back to the atmosphere before these
compounds reach the Arctic. Contamination of the
Arctic aquatic ecosystems results in the transfer of
these compounds through the food web and biomagnification in marine mammals. Inuits, a native
Arctic region or Northern peoples, hunt several of
these marine mammals and eat their tissues. The resulting contamination of mother’s breast milk transfers these chemicals to infants. There are good
reasons to be concerned that subsequent normal development of the children is impaired or slowed. This
is the net result of actions of human civilization and
complex environmental processes operating over
decades and distances of thousands of kilometers.
Table 2 Trends in concentrations of selected chlorinated
hydrocarbons 1986–95 in bivalves (mussels and oysters), US
coastal areas
a
Chemical
Number of sampling locations
Increased
Decreased
No trend
Chlordane
1
81
104
DDT
1
38
147
Dieldrin
1
32
153
PCBs
1
37
148
a Sites of several elevated concentrations are indicated in
Figure 6. Data obtained from the US Department of Commerce,
National Oceanic and Atmospheric Administration World Wide
Web Site, October, 2000 http://state-of-coast.noaa.gov/bulletins.
Data compiled by Dr Thomas P. O’Connor, US NOAA.
0
5
10
15
20
0
5
10
15
20
25
1971 1973 1975 1977 1979 1981 1983 1985 1987 1989
PCB
DDT
PCB residue concentration
( g g fat wt.)
μ
_ 1
DDT residue concentration
( g g fat wt.)
μ
_ 1
Figure 7 Time trends of DDT (J) and PCB () concentrations in cod liver oil from the southern Baltic, 1971–89. (Adapted from
Kannan et al., 1992.)
CHLORINATED HYDROCARBONS 173
ecosystems with a significant burden of DDT or PCBs
in surface sediments as a result of past inputs.
The trends in DDT and PCB concentrations, and
two other chlorinated hydrocarbon pesticides,
chlordane and dieldrin, in bivalve tissues at locations
in the US coastal area for 1986 to 1995 are summarized in Table 2. The decrease noted from limited
sampling for a few areas in the 1970s and early
1980s continues for some locations. For many other
locations, examination of the data indicates that the
concentrations are so low that general global and
regional biogeochemical cycles are causing only a
slow further decrease. A few stations continue to
maintain elevated concentrations and for most this
can be attributed to continuing contamination of the
bivalves from nearby surface sediments containing
high concentrations of the compounds.
Similar types of ‘Mussel or Oyster Watch’ data
have been collected in some European countries (e.g.,
France) with similar results. Prototypes of this
approach have been carried out in the 1990s for
developing countries of Central and South America
and South-east Asia under the auspices of UNESCOIOC and UNEP. Other time trends of DDT and PCB
concentrations have been assessed such as concentrations in cod liver oil collected from samples in the
southern Baltic Sea from 1971 to 1989 (Figure 7).
Consistent with the preceding discussion, DDT
concentrations decrease by a factor of three to four
comparing 1971–1974 with 1987–1989 and PCB
concentrations decrease at a slower rate.
The following summary of one aspect of the PCB
and chlorinated pesticide saga illustrates the importance of understanding the global, regional, and local
biogeochemical cycles of these compounds and their
relationship to environmental and human health
risks. PCBs and several chlorinated pesticides released
to the environment in developed countries of the
Northern Hemisphere enter the atmosphere from
land and from surface ocean waters in the tropics,
subtropics, and temperate zones. Subsequently these
compounds are transported by atmospheric circulation patterns to Arctic regions, and enter Arctic
ecosystems by precipitation and dry deposition.
There may be several cycles of precipitation and
volatilization back to the atmosphere before these
compounds reach the Arctic. Contamination of the
Arctic aquatic ecosystems results in the transfer of
these compounds through the food web and biomagnification in marine mammals. Inuits, a native
Arctic region or Northern peoples, hunt several of
these marine mammals and eat their tissues. The resulting contamination of mother’s breast milk transfers these chemicals to infants. There are good
reasons to be concerned that subsequent normal development of the children is impaired or slowed. This
is the net result of actions of human civilization and
complex environmental processes operating over
decades and distances of thousands of kilometers.
Table 2 Trends in concentrations of selected chlorinated
hydrocarbons 1986–95 in bivalves (mussels and oysters), US
coastal areas
a
Chemical
Number of sampling locations
Increased
Decreased
No trend
Chlordane
1
81
104
DDT
1
38
147
Dieldrin
1
32
153
PCBs
1
37
148
a Sites of several elevated concentrations are indicated in
Figure 6. Data obtained from the US Department of Commerce,
National Oceanic and Atmospheric Administration World Wide
Web Site, October, 2000 http://state-of-coast.noaa.gov/bulletins.
Data compiled by Dr Thomas P. O’Connor, US NOAA.
0
5
10
15
20
0
5
10
15
20
25
1971 1973 1975 1977 1979 1981 1983 1985 1987 1989
PCB
DDT
PCB residue concentration
( g g fat wt.)
μ
_ 1
DDT residue concentration
( g g fat wt.)
μ
_ 1
Figure 7 Time trends of DDT (J) and PCB () concentrations in cod liver oil from the southern Baltic, 1971–89. (Adapted from
Kannan et al., 1992.)
CHLORINATED HYDROCARBONS 173