

solubility of the gas. This value is then adjusted for
what the percent surface saturation is thought to be
based on the measured temperature and salinity, then
matched to the atmospheric time histories, and a
corresponding year is assigned to the water mass.
This age is an average of the water parcel. The pCFC
is used to calculate the age of upper ocean waters,
because at low concentrations the effects of dilution
will bias the age toward the older components of a
mixture.
The age can also be calculated using the ratio of
two CFCs; instead of using one pCFC the ratio of
two pCFCs are used. In this case no assumptions are
needed about surface equilibrium saturation at the
time of water mass formation. Since the atmospheric
changes in the ratio of CFC-11/CFC-12 have remained unchanged since the mid-1970s, this restricts
the application of the ratio age for CFC-11 and CFC12 to waters dating back further than 1975. However, either CFC-11 or CFC-12 can be combined
with CFC-113 to extend age estimates to the present.
Similarly they can be combined with CCl 4 to extend
age estimates further into the past. Unlike the pCFC
age, the ratio ages are actually the ages of the CFCbearing components. Figure 4 shows sections of CFC
ratio ages from the eastern North Atlantic and North
Pacific oceans. Note that the intermediate and deep
waters of the eastern North Atlantic (between 2000
0
10
20
30
5000
4000
3000
2000
1000
0
33
34
35
36
37
Potential temperature (˚C)
Pressure (dB)
Salinity
P17C, stn20
0
10
20
30
5000
4000
3000
2000
1000
0
33
34
35
36
37
Potential temperature (˚C)
Pressure (dB)
0
1
2
3
5000
4000
3000
2000
1000
0
0
1
2
3
4
Pressure (dB)
4
0
1
2
3
5000
4000
3000
2000
1000
0
0
1
2
3
4
Pressure (dB)
4
5000
4000
3000
2000
1000
0
0 50 100 150 200 250 300
Oxygen ( mol kg )
μ
_ 1
Pressure (dB)
CFC-11 (pmol kg )
_ 1
5000
4000
3000
2000
1000
0
0 50 100 150 200 250 300
Oxygen ( mol kg )
μ
_ 1
Pressure (dB)
CFC-12 (pmol kg )
_ 1
P17C, stn20
P17C, stn20
(A)
(B)
CFC-11 (pmol kg )
_ 1
(C)
(D)
(E)
(F)
Salinity
CFC-12 (pmol kg )
_ 1
STACS4, stn7
STACS4, stn7
STACS4, stn7
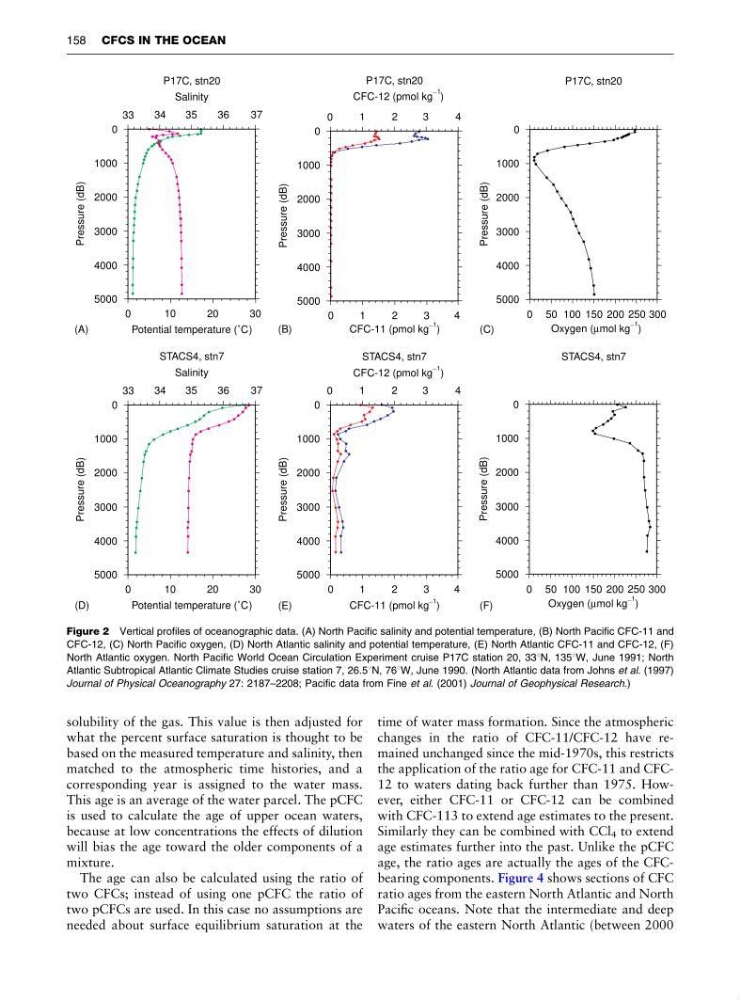
Figure 2 Vertical profiles of oceanographic data. (A) North Pacific salinity and potential temperature, (B) North Pacific CFC-11 and
CFC-12, (C) North Pacific oxygen, (D) North Atlantic salinity and potential temperature, (E) North Atlantic CFC-11 and CFC-12, (F)
North Atlantic oxygen. North Pacific World Ocean Circulation Experiment cruise P17C station 20, 331N, 1351W, June 1991; North
Atlantic Subtropical Atlantic Climate Studies cruise station 7, 26.51N, 761W, June 1990. (North Atlantic data from Johns et al. (1997)
Journal of Physical Oceanography 27: 2187–2208; Pacific data from Fine et al. (2001) Journal of Geophysical Research.)
158 CFCS IN THE OCEAN
what the percent surface saturation is thought to be
based on the measured temperature and salinity, then
matched to the atmospheric time histories, and a
corresponding year is assigned to the water mass.
This age is an average of the water parcel. The pCFC
is used to calculate the age of upper ocean waters,
because at low concentrations the effects of dilution
will bias the age toward the older components of a
mixture.
The age can also be calculated using the ratio of
two CFCs; instead of using one pCFC the ratio of
two pCFCs are used. In this case no assumptions are
needed about surface equilibrium saturation at the
time of water mass formation. Since the atmospheric
changes in the ratio of CFC-11/CFC-12 have remained unchanged since the mid-1970s, this restricts
the application of the ratio age for CFC-11 and CFC12 to waters dating back further than 1975. However, either CFC-11 or CFC-12 can be combined
with CFC-113 to extend age estimates to the present.
Similarly they can be combined with CCl 4 to extend
age estimates further into the past. Unlike the pCFC
age, the ratio ages are actually the ages of the CFCbearing components. Figure 4 shows sections of CFC
ratio ages from the eastern North Atlantic and North
Pacific oceans. Note that the intermediate and deep
waters of the eastern North Atlantic (between 2000
0
10
20
30
5000
4000
3000
2000
1000
0
33
34
35
36
37
Potential temperature (˚C)
Pressure (dB)
Salinity
P17C, stn20
0
10
20
30
5000
4000
3000
2000
1000
0
33
34
35
36
37
Potential temperature (˚C)
Pressure (dB)
0
1
2
3
5000
4000
3000
2000
1000
0
0
1
2
3
4
Pressure (dB)
4
0
1
2
3
5000
4000
3000
2000
1000
0
0
1
2
3
4
Pressure (dB)
4
5000
4000
3000
2000
1000
0
0 50 100 150 200 250 300
Oxygen ( mol kg )
μ
_ 1
Pressure (dB)
CFC-11 (pmol kg )
_ 1
5000
4000
3000
2000
1000
0
0 50 100 150 200 250 300
Oxygen ( mol kg )
μ
_ 1
Pressure (dB)
CFC-12 (pmol kg )
_ 1
P17C, stn20
P17C, stn20
(A)
(B)
CFC-11 (pmol kg )
_ 1
(C)
(D)
(E)
(F)
Salinity
CFC-12 (pmol kg )
_ 1
STACS4, stn7
STACS4, stn7
STACS4, stn7
Figure 2 Vertical profiles of oceanographic data. (A) North Pacific salinity and potential temperature, (B) North Pacific CFC-11 and
CFC-12, (C) North Pacific oxygen, (D) North Atlantic salinity and potential temperature, (E) North Atlantic CFC-11 and CFC-12, (F)
North Atlantic oxygen. North Pacific World Ocean Circulation Experiment cruise P17C station 20, 331N, 1351W, June 1991; North
Atlantic Subtropical Atlantic Climate Studies cruise station 7, 26.51N, 761W, June 1990. (North Atlantic data from Johns et al. (1997)
Journal of Physical Oceanography 27: 2187–2208; Pacific data from Fine et al. (2001) Journal of Geophysical Research.)
158 CFCS IN THE OCEAN