

by radioactive decay of the parent isotope of at least
one isotope in the tracer’s sources or cosmogenic
production. The elements currently in use for paleooceanography are given in Table 1.
As apparent from the properties listed in Table 1,
ocean chemists have a variety of tracers at hand,
covering a range of residence times and chemical
behaviors. Those tracers varying due to radioactive
decay have distinct isotopic compositions in their
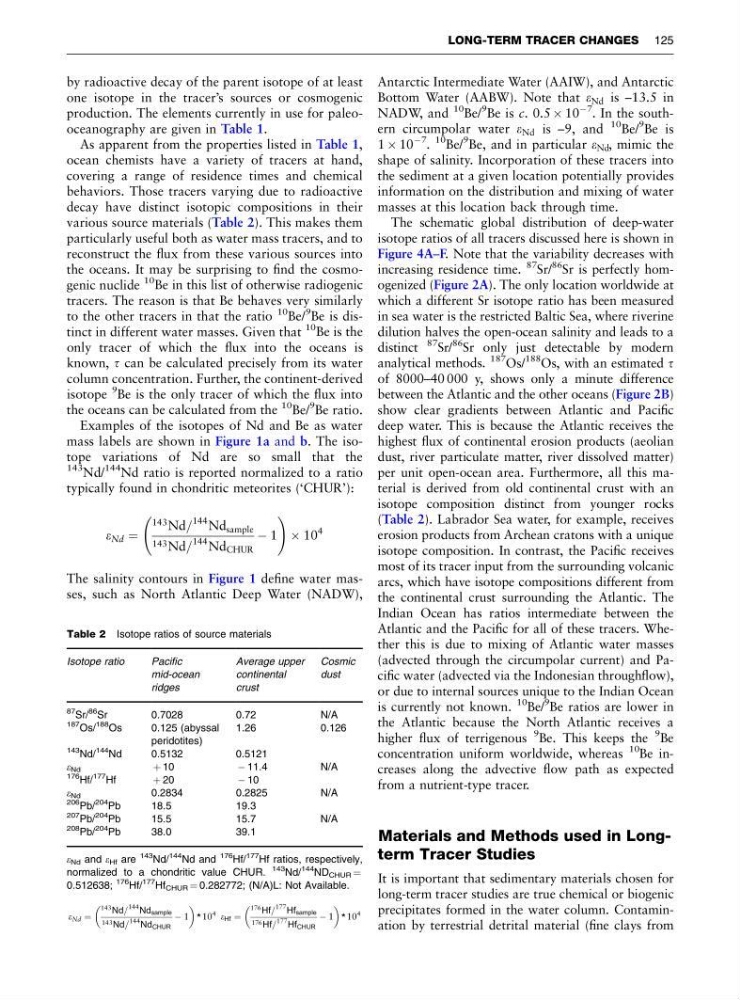
various source materials (Table 2). This makes them
particularly useful both as water mass tracers, and to
reconstruct the flux from these various sources into
the oceans. It may be surprising to find the cosmogenic nuclide
10 Be in this list of otherwise radiogenic
tracers. The reason is that Be behaves very similarly
to the other tracers in that the ratio
10 Be/
9
Be is distinct in different water masses. Given that
10 Be is the
only tracer of which the flux into the oceans is
known, t can be calculated precisely from its water
column concentration. Further, the continent-derived
isotope
9 Be is the only tracer of which the flux into
the oceans can be calculated from the
10
Be/
9
Be ratio.
Examples of the isotopes of Nd and Be as water
mass labels are shown in Figure 1a and b. The isotope variations of Nd are so small that the
143 Nd/
144
Nd ratio is reported normalized to a ratio
typically found in chondritic meteorites (‘CHUR’):
e Nd ¼
143 Nd=
144 Nd sample
143 Nd=
144 Nd CHUR
À 1
!
 10
4
The salinity contours in Figure 1 define water masses, such as North Atlantic Deep Water (NADW),
Antarctic Intermediate Water (AAIW), and Antarctic
Bottom Water (AABW). Note that e Nd is –13.5 in
NADW, and
10
Be/
9 Be is c. 0.5 Â 10
À7
. In the southern circumpolar water e Nd is –9, and
10 Be/
9
Be is
1 Â 10
À7
.
10
Be/
9 Be, and in particular e Nd , mimic the
shape of salinity. Incorporation of these tracers into
the sediment at a given location potentially provides
information on the distribution and mixing of water
masses at this location back through time.
The schematic global distribution of deep-water
isotope ratios of all tracers discussed here is shown in
Figure 4A–F. Note that the variability decreases with
increasing residence time.
87
Sr/
86
Sr is perfectly homogenized (Figure 2A). The only location worldwide at
which a different Sr isotope ratio has been measured
in sea water is the restricted Baltic Sea, where riverine
dilution halves the open-ocean salinity and leads to a
distinct
87
Sr/
86
Sr only just detectable by modern
analytical methods.
187
Os/
188
Os, with an estimated t
of 8000–40 000 y, shows only a minute difference
between the Atlantic and the other oceans (Figure 2B)
show clear gradients between Atlantic and Pacific
deep water. This is because the Atlantic receives the
highest flux of continental erosion products (aeolian
dust, river particulate matter, river dissolved matter)
per unit open-ocean area. Furthermore, all this material is derived from old continental crust with an
isotope composition distinct from younger rocks
(Table 2). Labrador Sea water, for example, receives
erosion products from Archean cratons with a unique
isotope composition. In contrast, the Pacific receives
most of its tracer input from the surrounding volcanic
arcs, which have isotope compositions different from
the continental crust surrounding the Atlantic. The
Indian Ocean has ratios intermediate between the
Atlantic and the Pacific for all of these tracers. Whether this is due to mixing of Atlantic water masses
(advected through the circumpolar current) and Pacific water (advected via the Indonesian throughflow),
or due to internal sources unique to the Indian Ocean
is currently not known.
10
Be/
9
Be ratios are lower in
the Atlantic because the North Atlantic receives a
higher flux of terrigenous
9
Be. This keeps the
9
Be
concentration uniform worldwide, whereas
10
Be increases along the advective flow path as expected
from a nutrient-type tracer.
Materials and Methods used in Longterm Tracer Studies
It is important that sedimentary materials chosen for
long-term tracer studies are true chemical or biogenic
precipitates formed in the water column. Contamination by terrestrial detrital material (fine clays from
Table 2 Isotope ratios of source materials
Isotope ratio
Pacific
mid-ocean
ridges
Average upper
continental
crust
Cosmic
dust
87
Sr/
86
Sr
0.7028
0.72
N/A
187
Os/
188 Os
0.125 (abyssal
peridotites)
1.26
0.126
143
Nd/
144
Nd
0.5132
0.5121
e Nd
þ 10
À 11.4
N/A
176
Hf/
177
Hf
þ 20
À 10
e Nd
0.2834
0.2825
N/A
206
Pb/
204
Pb
18.5
19.3
207
Pb/
204
Pb
15.5
15.7
N/A
208
Pb/
204
Pb
38.0
39.1
e Nd and e Hf are
143 Nd/
144 Nd and
176
Hf/
177 Hf ratios, respectively,
normalized to a chondritic value CHUR.
143 Nd/
144
ND CHUR ¼
0.512638;
176 Hf/
177 Hf CHUR ¼ 0.282772; (N/A)L: Not Available.
e Nd ¼
143 Nd=
144 Nd sample
143 Nd=
144 Nd CHUR
À 1
* 10
4 e Hf ¼
176 Hf=
177 Hf sample
176 Hf=
177 Hf CHUR
À 1
* 10
4
LONG-TERM TRACER CHANGES 125
one isotope in the tracer’s sources or cosmogenic
production. The elements currently in use for paleooceanography are given in Table 1.
As apparent from the properties listed in Table 1,
ocean chemists have a variety of tracers at hand,
covering a range of residence times and chemical
behaviors. Those tracers varying due to radioactive
decay have distinct isotopic compositions in their
various source materials (Table 2). This makes them
particularly useful both as water mass tracers, and to
reconstruct the flux from these various sources into
the oceans. It may be surprising to find the cosmogenic nuclide
10 Be in this list of otherwise radiogenic
tracers. The reason is that Be behaves very similarly
to the other tracers in that the ratio
10 Be/
9
Be is distinct in different water masses. Given that
10 Be is the
only tracer of which the flux into the oceans is
known, t can be calculated precisely from its water
column concentration. Further, the continent-derived
isotope
9 Be is the only tracer of which the flux into
the oceans can be calculated from the
10
Be/
9
Be ratio.
Examples of the isotopes of Nd and Be as water
mass labels are shown in Figure 1a and b. The isotope variations of Nd are so small that the
143 Nd/
144
Nd ratio is reported normalized to a ratio
typically found in chondritic meteorites (‘CHUR’):
e Nd ¼
143 Nd=
144 Nd sample
143 Nd=
144 Nd CHUR
À 1
!
 10
4
The salinity contours in Figure 1 define water masses, such as North Atlantic Deep Water (NADW),
Antarctic Intermediate Water (AAIW), and Antarctic
Bottom Water (AABW). Note that e Nd is –13.5 in
NADW, and
10
Be/
9 Be is c. 0.5 Â 10
À7
. In the southern circumpolar water e Nd is –9, and
10 Be/
9
Be is
1 Â 10
À7
.
10
Be/
9 Be, and in particular e Nd , mimic the
shape of salinity. Incorporation of these tracers into
the sediment at a given location potentially provides
information on the distribution and mixing of water
masses at this location back through time.
The schematic global distribution of deep-water
isotope ratios of all tracers discussed here is shown in
Figure 4A–F. Note that the variability decreases with
increasing residence time.
87
Sr/
86
Sr is perfectly homogenized (Figure 2A). The only location worldwide at
which a different Sr isotope ratio has been measured
in sea water is the restricted Baltic Sea, where riverine
dilution halves the open-ocean salinity and leads to a
distinct
87
Sr/
86
Sr only just detectable by modern
analytical methods.
187
Os/
188
Os, with an estimated t
of 8000–40 000 y, shows only a minute difference
between the Atlantic and the other oceans (Figure 2B)
show clear gradients between Atlantic and Pacific
deep water. This is because the Atlantic receives the
highest flux of continental erosion products (aeolian
dust, river particulate matter, river dissolved matter)
per unit open-ocean area. Furthermore, all this material is derived from old continental crust with an
isotope composition distinct from younger rocks
(Table 2). Labrador Sea water, for example, receives
erosion products from Archean cratons with a unique
isotope composition. In contrast, the Pacific receives
most of its tracer input from the surrounding volcanic
arcs, which have isotope compositions different from
the continental crust surrounding the Atlantic. The
Indian Ocean has ratios intermediate between the
Atlantic and the Pacific for all of these tracers. Whether this is due to mixing of Atlantic water masses
(advected through the circumpolar current) and Pacific water (advected via the Indonesian throughflow),
or due to internal sources unique to the Indian Ocean
is currently not known.
10
Be/
9
Be ratios are lower in
the Atlantic because the North Atlantic receives a
higher flux of terrigenous
9
Be. This keeps the
9
Be
concentration uniform worldwide, whereas
10
Be increases along the advective flow path as expected
from a nutrient-type tracer.
Materials and Methods used in Longterm Tracer Studies
It is important that sedimentary materials chosen for
long-term tracer studies are true chemical or biogenic
precipitates formed in the water column. Contamination by terrestrial detrital material (fine clays from
Table 2 Isotope ratios of source materials
Isotope ratio
Pacific
mid-ocean
ridges
Average upper
continental
crust
Cosmic
dust
87
Sr/
86
Sr
0.7028
0.72
N/A
187
Os/
188 Os
0.125 (abyssal
peridotites)
1.26
0.126
143
Nd/
144
Nd
0.5132
0.5121
e Nd
þ 10
À 11.4
N/A
176
Hf/
177
Hf
þ 20
À 10
e Nd
0.2834
0.2825
N/A
206
Pb/
204
Pb
18.5
19.3
207
Pb/
204
Pb
15.5
15.7
N/A
208
Pb/
204
Pb
38.0
39.1
e Nd and e Hf are
143 Nd/
144 Nd and
176
Hf/
177 Hf ratios, respectively,
normalized to a chondritic value CHUR.
143 Nd/
144
ND CHUR ¼
0.512638;
176 Hf/
177 Hf CHUR ¼ 0.282772; (N/A)L: Not Available.
e Nd ¼
143 Nd=
144 Nd sample
143 Nd=
144 Nd CHUR
À 1
* 10
4 e Hf ¼
176 Hf=
177 Hf sample
176 Hf=
177 Hf CHUR
À 1
* 10
4
LONG-TERM TRACER CHANGES 125