

Integrating over wavelength provides the total production (consumption) rate at each depth.
Integration of eqn [7] from the surface to depth z
provides the spectral dependence of the photochemical flux ðYÞ over this interval
Y l; z
ð Þ ¼
E D0 ðlÞ: 1 À e
ÀK d l
ð ÞÁz
À
Á
Á F i l
ð Þ Á a i l
ð Þ=K d l
ð Þ
m D
½8
which upon substitution of eqn [4] becomes,
Y l; z
ð Þ ¼E D0 ðlÞ: 1 À e
ÀK d l
ð ÞÁz
Á F i l
ð ÞÁ
a i l
ð Þ
P a i l
ð Þ þ
P b bi l
ð Þ
½9
In most, but not all seawaters, the total absorption
will be much greater than the total backscatter,
Wavelength (nm)
(C)
(B)
(A)
300
350
400
450
Solar irradiance
CDOM
0.03
0.02
0.01
0.00
2x10
7
2.0 x 10
14
Solar irradiance
(photons cm
_
2
s
_
1
nm
_
1
)
1.5 x 10
14
1.0 x 10
14
0.5 x 10
14
0.0
1x10
7
10
7
10
6
10
5
10
4
10
3
10
2
10
1
0
a
CDOM (cm
_
1
)
F (molecules cm
_
3
s
_
1
nm
_
1
)
log
F
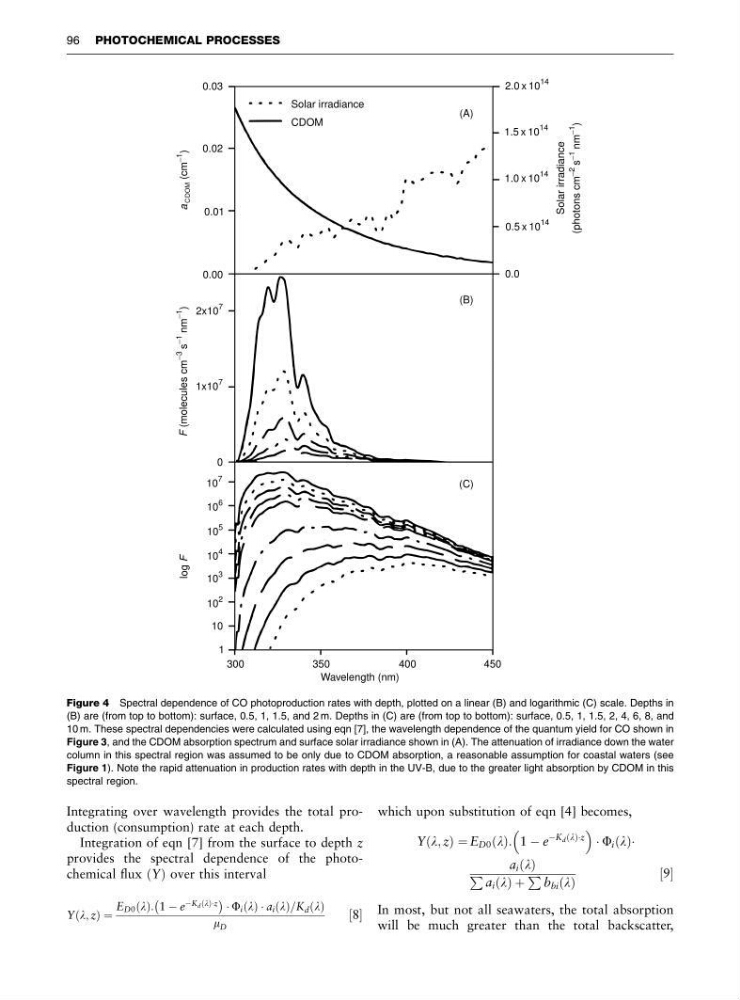
Figure 4 Spectral dependence of CO photoproduction rates with depth, plotted on a linear (B) and logarithmic (C) scale. Depths in
(B) are (from top to bottom): surface, 0.5, 1, 1.5, and 2 m. Depths in (C) are (from top to bottom): surface, 0.5, 1, 1.5, 2, 4, 6, 8, and
10 m. These spectral dependencies were calculated using eqn [7], the wavelength dependence of the quantum yield for CO shown in
Figure 3, and the CDOM absorption spectrum and surface solar irradiance shown in (A). The attenuation of irradiance down the water
column in this spectral region was assumed to be only due to CDOM absorption, a reasonable assumption for coastal waters (see
Figure 1). Note the rapid attenuation in production rates with depth in the UV-B, due to the greater light absorption by CDOM in this
spectral region.
96 PHOTOCHEMICAL PROCESSES
Integration of eqn [7] from the surface to depth z
provides the spectral dependence of the photochemical flux ðYÞ over this interval
Y l; z
ð Þ ¼
E D0 ðlÞ: 1 À e
ÀK d l
ð ÞÁz
À
Á
Á F i l
ð Þ Á a i l
ð Þ=K d l
ð Þ
m D
½8
which upon substitution of eqn [4] becomes,
Y l; z
ð Þ ¼E D0 ðlÞ: 1 À e
ÀK d l
ð ÞÁz
Á F i l
ð ÞÁ
a i l
ð Þ
P a i l
ð Þ þ
P b bi l
ð Þ
½9
In most, but not all seawaters, the total absorption
will be much greater than the total backscatter,
Wavelength (nm)
(C)
(B)
(A)
300
350
400
450
Solar irradiance
CDOM
0.03
0.02
0.01
0.00
2x10
7
2.0 x 10
14
Solar irradiance
(photons cm
_
2
s
_
1
nm
_
1
)
1.5 x 10
14
1.0 x 10
14
0.5 x 10
14
0.0
1x10
7
10
7
10
6
10
5
10
4
10
3
10
2
10
1
0
a
CDOM (cm
_
1
)
F (molecules cm
_
3
s
_
1
nm
_
1
)
log
F
Figure 4 Spectral dependence of CO photoproduction rates with depth, plotted on a linear (B) and logarithmic (C) scale. Depths in
(B) are (from top to bottom): surface, 0.5, 1, 1.5, and 2 m. Depths in (C) are (from top to bottom): surface, 0.5, 1, 1.5, 2, 4, 6, 8, and
10 m. These spectral dependencies were calculated using eqn [7], the wavelength dependence of the quantum yield for CO shown in
Figure 3, and the CDOM absorption spectrum and surface solar irradiance shown in (A). The attenuation of irradiance down the water
column in this spectral region was assumed to be only due to CDOM absorption, a reasonable assumption for coastal waters (see
Figure 1). Note the rapid attenuation in production rates with depth in the UV-B, due to the greater light absorption by CDOM in this
spectral region.
96 PHOTOCHEMICAL PROCESSES