

A control
B Acetate lim
C Acetate lim + 10 ppm
181-1
D 100 ppm 181-1
T h
1
2
3
1
2
3
1
2
3
1
2
3
0
1.7 x 10³
NA
1.1 x 10 2 1.1 X l02
NA
3.9 x 10 2 1.9 x 10 3
NA
2.1 x 10 2 3.0 x l03
NA
3.5 x I0 2
24
3.0 x 10 4 1.9 x 10 4 1.6 x 10 3 4.2 x 10³ 3.2 x 10 4 3.8 x 10 3 4.3 x 10 4 3.3 x 10 4 1.5 x 10³ 3.1 x 10⁴ 3.5 x 10 4 4.6 x 10³
48
1.2 x 10 5 9.0 x 10 4 9.6 x 10 4 4.9 x 10 4 2.9 x 10 4 4.1 x 10 3 1.6 x 10⁵ 1.7 x 10⁵ 1.4 x 10 4 2.9 x 10 4 3.3 x 10 4 5.2 x 10³
72
4.2 x 10⁵ 3.5 x 10⁵ 3.5 x 10 4 1.3 x 10⁶ 1.5 x 10⁶ 5.5 x 10 4 8.3 x 10 5 7.2 x 10⁵ 7.8 x 10 4 4.8 x 10⁵ 7.2 x 10⁵ 4.6 x 10⁵
96
9.1 x 10 5 6.0 x 10⁵ 1.4 x 10 5 4.8 x 10⁵ 3.8 x 10⁵ 9.8 x 10 4 8.1 x 10⁵ 7.4 x 10⁵ 3.8 x 10⁵ 6.6 x 10⁵ 5.4 x 10 5 3.5 x 10⁵
120
2.3 x 10⁵ 3.5 x 10⁵ 2.5 x 10⁵ 1.4 x 10⁶ 1.8 x 10⁶ 2.5 x 10⁵ 1.9 x 10⁶ 2.0 x 10⁶ 2.8 x 10⁶ 1.2 x 10⁶ 2.6 x 10⁶ 2.8 x 10⁶
132
2.7 x 10 5 1.5 x 10⁵ 2.8 x 10 4 2.1 x 10⁶ 1.4 x 10⁶ 3.9 x 10⁵ 2.3 x 10⁶ 1.0 x 10⁶ 1.6 x 10⁶ 5.3 x 10⁵ 5.5 x 10⁵ 4.3 x 10⁶
144
1.8 x 10⁵ 2.7 x 10⁵ 8.4 x 10 4 1.8 x 10⁶ 2.3 x 10⁶ 6.9 x 10 5 1.4 x 10 6 1.6 x 10⁶ 1.7 x 10⁶ 1.8 x 10⁶ 9.4 x 10⁵ 6.6 x 10⁶
Viable counts cfu ml -1
1 : Artificial Sea Water Agar (ASWA)
NA = Not available.
2 : ASWA + 10 ppm 181-1
3 : ASWA + 100 ppm 181-1
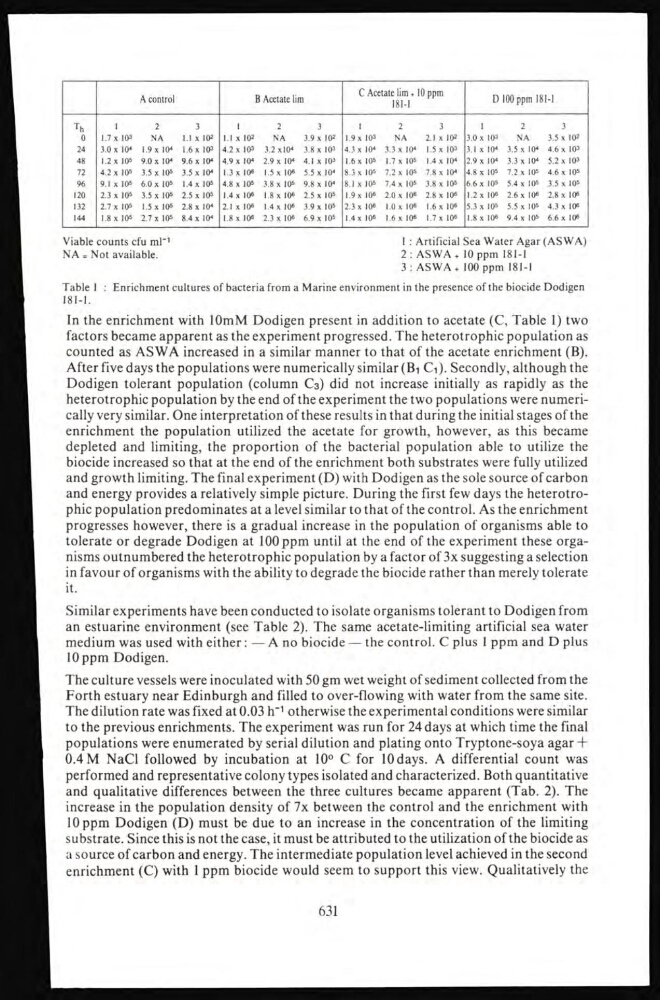
Table 1 : Enrichment cultures of bacteria from a Marine environment in the presence of the biocide Dodigen
181-1.
In the enrichment with 10mM Dodigen present in addition to acetate (C, Table 1) two
factors became apparent as the experiment progressed. The heterotrophic population as
counted as ASWA increased in a similar manner to that of the acetate enrichment (B).
After five days the populations were numerically similar (B1 C1). Secondly, although the
Dodigen tolerant population (column C3) did not increase initially as rapidly as the
heterotrophic population by the end of the experiment the two populations were numerically very similar. One interpretation of these results in that during the initial stages of the
enrichment the population utilized the acetate for growth, however, as this became
depleted and limiting, the proportion of the bacterial population able to utilize the
biocide increased so that at the end of the enrichment both substrates were fully utilized
and growth limiting. The final experiment (D) with Dodigen as the sole source of carbon
and energy provides a relatively simple picture. During the first few days the heterotrophic population predominates at a level similar to that of the control. As the enrichment
progresses however, there is a gradual increase in the population of organisms able to
tolerate or degrade Dodigen at 100 ppm until at the end of the experiment these organisms outnumbered the heterotrophic population by a factor of 3x suggesting a selection
in favour of organisms with the ability to degrade the biocide rather than merely tolerate
it.
Similar experiments have been conducted to isolate organisms tolerant to Dodigen from
an estuarine environment (see Table 2). The same acetate-limiting artificial sea water
medium was used with either : — A no biocide — the control. C plus 1 ppm and D plus
10 ppm Dodigen.
The culture vessels were inoculated with 50 gm wet weight of sediment collected from the
Forth estuary near Edinburgh and filled to over-flowing with water from the same site.
The dilution rate was fixed at 0.03 h -1 otherwise the experimental conditions were similar
to the previous enrichments. The experiment was run for 24 days at which time the final
populations were enumerated by serial dilution and plating onto Tryptone-soya agar +
0.4 M NaCl followed by incubation at 10° C for 10 days. A differential count was
performed and representative colony types isolated and characterized. Both quantitative
and qualitative differences between the three cultures became apparent (Tab. 2). The
increase in the population density of 7x between the control and the enrichment with
10 ppm Dodigen (D) must be due to an increase in the concentration of the limiting
substrate. Since this is not the case, it must be attributed to the utilization of the biocide as
a source of carbon and energy. The intermediate population level achieved in the second
enrichment (C) with 1 ppm biocide would seem to support this view. Qualitatively the
631
B Acetate lim
C Acetate lim + 10 ppm
181-1
D 100 ppm 181-1
T h
1
2
3
1
2
3
1
2
3
1
2
3
0
1.7 x 10³
NA
1.1 x 10 2 1.1 X l02
NA
3.9 x 10 2 1.9 x 10 3
NA
2.1 x 10 2 3.0 x l03
NA
3.5 x I0 2
24
3.0 x 10 4 1.9 x 10 4 1.6 x 10 3 4.2 x 10³ 3.2 x 10 4 3.8 x 10 3 4.3 x 10 4 3.3 x 10 4 1.5 x 10³ 3.1 x 10⁴ 3.5 x 10 4 4.6 x 10³
48
1.2 x 10 5 9.0 x 10 4 9.6 x 10 4 4.9 x 10 4 2.9 x 10 4 4.1 x 10 3 1.6 x 10⁵ 1.7 x 10⁵ 1.4 x 10 4 2.9 x 10 4 3.3 x 10 4 5.2 x 10³
72
4.2 x 10⁵ 3.5 x 10⁵ 3.5 x 10 4 1.3 x 10⁶ 1.5 x 10⁶ 5.5 x 10 4 8.3 x 10 5 7.2 x 10⁵ 7.8 x 10 4 4.8 x 10⁵ 7.2 x 10⁵ 4.6 x 10⁵
96
9.1 x 10 5 6.0 x 10⁵ 1.4 x 10 5 4.8 x 10⁵ 3.8 x 10⁵ 9.8 x 10 4 8.1 x 10⁵ 7.4 x 10⁵ 3.8 x 10⁵ 6.6 x 10⁵ 5.4 x 10 5 3.5 x 10⁵
120
2.3 x 10⁵ 3.5 x 10⁵ 2.5 x 10⁵ 1.4 x 10⁶ 1.8 x 10⁶ 2.5 x 10⁵ 1.9 x 10⁶ 2.0 x 10⁶ 2.8 x 10⁶ 1.2 x 10⁶ 2.6 x 10⁶ 2.8 x 10⁶
132
2.7 x 10 5 1.5 x 10⁵ 2.8 x 10 4 2.1 x 10⁶ 1.4 x 10⁶ 3.9 x 10⁵ 2.3 x 10⁶ 1.0 x 10⁶ 1.6 x 10⁶ 5.3 x 10⁵ 5.5 x 10⁵ 4.3 x 10⁶
144
1.8 x 10⁵ 2.7 x 10⁵ 8.4 x 10 4 1.8 x 10⁶ 2.3 x 10⁶ 6.9 x 10 5 1.4 x 10 6 1.6 x 10⁶ 1.7 x 10⁶ 1.8 x 10⁶ 9.4 x 10⁵ 6.6 x 10⁶
Viable counts cfu ml -1
1 : Artificial Sea Water Agar (ASWA)
NA = Not available.
2 : ASWA + 10 ppm 181-1
3 : ASWA + 100 ppm 181-1
Table 1 : Enrichment cultures of bacteria from a Marine environment in the presence of the biocide Dodigen
181-1.
In the enrichment with 10mM Dodigen present in addition to acetate (C, Table 1) two
factors became apparent as the experiment progressed. The heterotrophic population as
counted as ASWA increased in a similar manner to that of the acetate enrichment (B).
After five days the populations were numerically similar (B1 C1). Secondly, although the
Dodigen tolerant population (column C3) did not increase initially as rapidly as the
heterotrophic population by the end of the experiment the two populations were numerically very similar. One interpretation of these results in that during the initial stages of the
enrichment the population utilized the acetate for growth, however, as this became
depleted and limiting, the proportion of the bacterial population able to utilize the
biocide increased so that at the end of the enrichment both substrates were fully utilized
and growth limiting. The final experiment (D) with Dodigen as the sole source of carbon
and energy provides a relatively simple picture. During the first few days the heterotrophic population predominates at a level similar to that of the control. As the enrichment
progresses however, there is a gradual increase in the population of organisms able to
tolerate or degrade Dodigen at 100 ppm until at the end of the experiment these organisms outnumbered the heterotrophic population by a factor of 3x suggesting a selection
in favour of organisms with the ability to degrade the biocide rather than merely tolerate
it.
Similar experiments have been conducted to isolate organisms tolerant to Dodigen from
an estuarine environment (see Table 2). The same acetate-limiting artificial sea water
medium was used with either : — A no biocide — the control. C plus 1 ppm and D plus
10 ppm Dodigen.
The culture vessels were inoculated with 50 gm wet weight of sediment collected from the
Forth estuary near Edinburgh and filled to over-flowing with water from the same site.
The dilution rate was fixed at 0.03 h -1 otherwise the experimental conditions were similar
to the previous enrichments. The experiment was run for 24 days at which time the final
populations were enumerated by serial dilution and plating onto Tryptone-soya agar +
0.4 M NaCl followed by incubation at 10° C for 10 days. A differential count was
performed and representative colony types isolated and characterized. Both quantitative
and qualitative differences between the three cultures became apparent (Tab. 2). The
increase in the population density of 7x between the control and the enrichment with
10 ppm Dodigen (D) must be due to an increase in the concentration of the limiting
substrate. Since this is not the case, it must be attributed to the utilization of the biocide as
a source of carbon and energy. The intermediate population level achieved in the second
enrichment (C) with 1 ppm biocide would seem to support this view. Qualitatively the
631