

slips, cut into 1.0 x 2.0 cm pieces, rinsed in ethanol and suspended in microcosms at the
sediment/water interface. Upon removal from the microcosms, the chitin pieces were
prepared using methods of Postek et al. (1980) and described by Scherbarth (1984). An
Hitachi S-500 scanning electron microscope was used for examination of each specimen.
RESULTS
Toxicant/Substrate Biotransformation Profiles
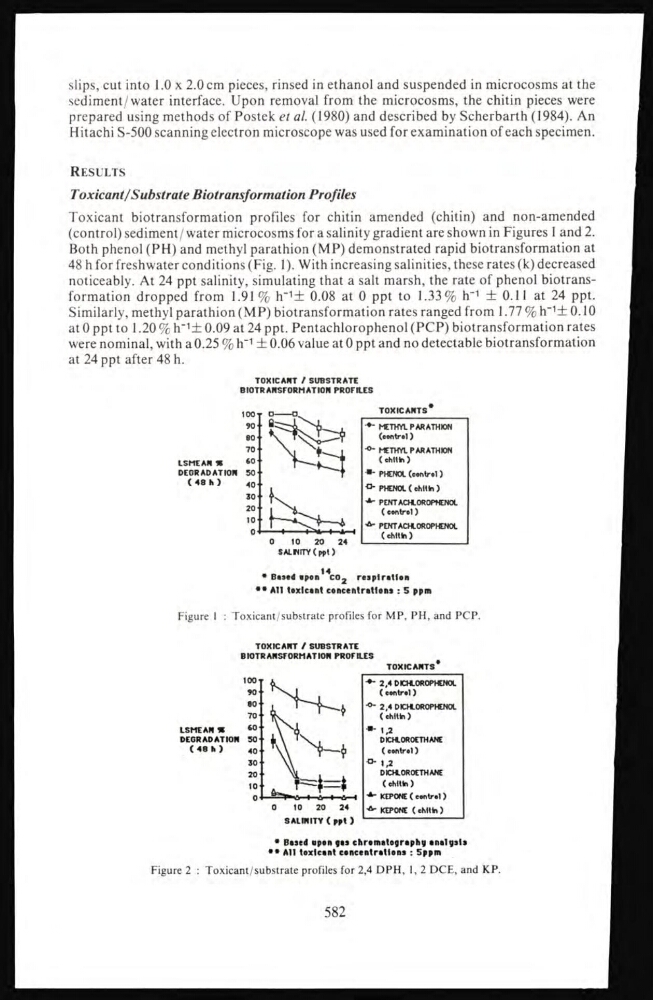
Toxicant biotransformation profiles for chitin amended (chitin) and non-amended
(control) sediment/water microcosms for a salinity gradient are shown in Figures 1 and 2.
Both phenol (PH) and methyl parathion (MP) demonstrated rapid biotransformation at
48 h for freshwater conditions (Fig. 1). With increasing salinities, these rates (k) decreased
noticeably. At 24 ppt salinity, simulating that a salt marsh, the rate of phenol biotransformation dropped from 1.91% h -1 ± 0.08 at 0 ppt to 1.33% h -1 ± 0.11 at 24 ppt.
Similarly, methyl parathion (MP) biotransformation rates ranged from 1.77 % h -1 ± 0.10
at 0 ppt to 1.20 % h -1 ± 0.09 at 24 ppt. Pentachlorophenol (PCP) biotransformation rates
were nominal, with a 0.25 % h"
1 ± 0.06 value at 0 ppt and no detectable biotransformation
at 24 ppt after 48 h.
TOXICANT / SUBSTRATE
BIOTRANSFORMATION PROFILES
TOXICANTS*
METHYL PARATHION
(control)
-o- METHYL PARATHION
( chitin )
-■- PHENOL (control )
PHENOL ( chitin )
-A- PENTACHLOROPHENOL
( control )
PENTACHLOROPHENOL
( chitin )
* Based spon
14 co 2
respiration
•• All toxicant concentrations : 5 ppm
Figure 1 : Toxicant/substrate profiles for MP, PH, and PCP.
TOXICANT / SUBSTRATE
BIOTRANSFORMATION PROFILES
TOXICANTS*
O
10
20
24
SALINITY ( ppt )
-A- 2,4 DICHLOROPHENOL
( control)
2,4 DICHLOROPHENOL
( chitin )
-■- 1,2
DICHLOROETHANE
( control)
1,2
DICHLOROETHANE
( chitin )
KEPONE ( control )
-A- KEPONE ( chitin )
-■- Based open «as chromatography analysis
*• All toxicant concentrations : 5ppm
Figure 2 : Toxicant/substrate profiles for 2,4 DPH, 1, 2 DCE, and KP.
582
sediment/water interface. Upon removal from the microcosms, the chitin pieces were
prepared using methods of Postek et al. (1980) and described by Scherbarth (1984). An
Hitachi S-500 scanning electron microscope was used for examination of each specimen.
RESULTS
Toxicant/Substrate Biotransformation Profiles
Toxicant biotransformation profiles for chitin amended (chitin) and non-amended
(control) sediment/water microcosms for a salinity gradient are shown in Figures 1 and 2.
Both phenol (PH) and methyl parathion (MP) demonstrated rapid biotransformation at
48 h for freshwater conditions (Fig. 1). With increasing salinities, these rates (k) decreased
noticeably. At 24 ppt salinity, simulating that a salt marsh, the rate of phenol biotransformation dropped from 1.91% h -1 ± 0.08 at 0 ppt to 1.33% h -1 ± 0.11 at 24 ppt.
Similarly, methyl parathion (MP) biotransformation rates ranged from 1.77 % h -1 ± 0.10
at 0 ppt to 1.20 % h -1 ± 0.09 at 24 ppt. Pentachlorophenol (PCP) biotransformation rates
were nominal, with a 0.25 % h"
1 ± 0.06 value at 0 ppt and no detectable biotransformation
at 24 ppt after 48 h.
TOXICANT / SUBSTRATE
BIOTRANSFORMATION PROFILES
TOXICANTS*
METHYL PARATHION
(control)
-o- METHYL PARATHION
( chitin )
-■- PHENOL (control )
PHENOL ( chitin )
-A- PENTACHLOROPHENOL
( control )
PENTACHLOROPHENOL
( chitin )
* Based spon
14 co 2
respiration
•• All toxicant concentrations : 5 ppm
Figure 1 : Toxicant/substrate profiles for MP, PH, and PCP.
TOXICANT / SUBSTRATE
BIOTRANSFORMATION PROFILES
TOXICANTS*
O
10
20
24
SALINITY ( ppt )
-A- 2,4 DICHLOROPHENOL
( control)
2,4 DICHLOROPHENOL
( chitin )
-■- 1,2
DICHLOROETHANE
( control)
1,2
DICHLOROETHANE
( chitin )
KEPONE ( control )
-A- KEPONE ( chitin )
-■- Based open «as chromatography analysis
*• All toxicant concentrations : 5ppm
Figure 2 : Toxicant/substrate profiles for 2,4 DPH, 1, 2 DCE, and KP.
582