

tion (Ayyakkannu and Chandramohan, 1971 ; Vanderpost and Dutka, 1971). However
the positive correlation might have been influenced by high organic matter (Rangaswami
et al. 1967 ; Vanderpost and Dutka, 1971). The actinomycetes was significantly negatively
correlated with clay. This is also another interesting observation since earlier reports
showed that clay sediments always contain more microbial population including actinomycetes (Paulraj, 1973). The fungal population was significantly positively correlated
with N/ P ratio and silt. However a significant negative correlation was observed between
fungal population and C/ N ratio. The oceanic variables such as temperature and salinity
vary greatly in nearshore environments where fresh water mixes with seawater. Such
changes in temperature and salinity may affect growth, metabolism and survival of
marine and freshwater bacteria. A good relationship seems to exist between salinity,
temperature and marine bacteria (Stanley and Morita, 1968 ; Cooper and Morita, 1972).
However, such relationship was not noticed in the sediments of Vellar estuary. No
correlation between pH and microbial taxa was reported previously (Rangaswami et al,
1967) and similar observation was made here also.
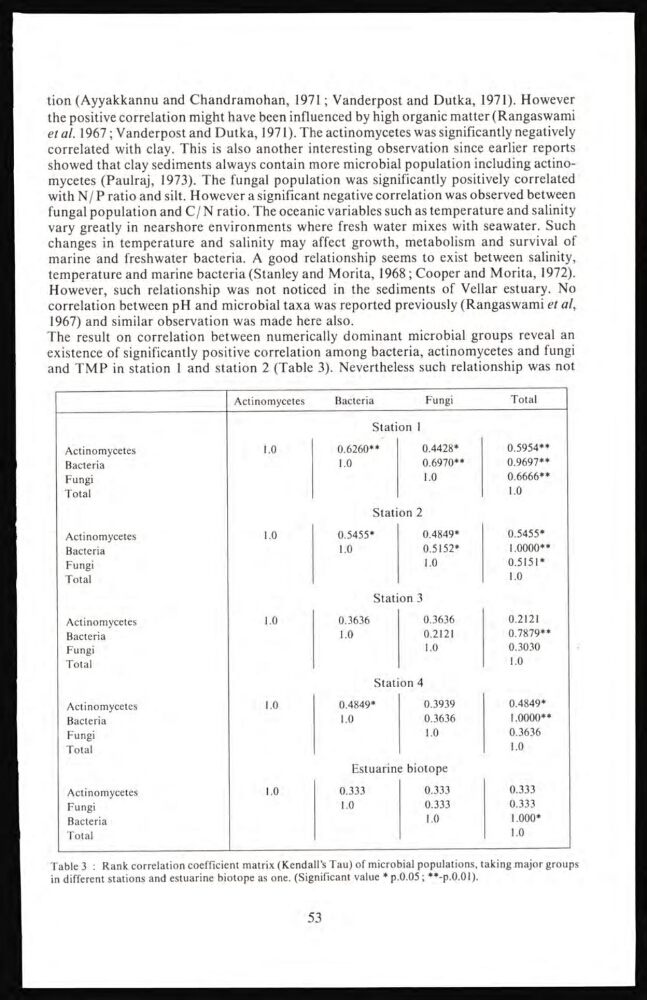
The result on correlation between numerically dominant microbial groups reveal an
existence of significantly positive correlation among bacteria, actinomycetes and fungi
and TMP in station 1 and station 2 (Table 3). Nevertheless such relationship was not
Actinomycetes
Bacteria
Fungi
Total
Station 1
Actinomycetes
1.0
0.6260**
0.4428*
0.5954**
Bacteria
1.0
0.6970**
0.9697**
Fungi
1.0
0.6666**
Total
1.0
Station 2
Actinomycetes
1.0
0.5455*
0.4849*
0.5455*
Bacteria
1.0
0.5152*
1.0000**
Fungi
1.0
0.5151*
Total
1.0
Station 3
Actinomycetes
1.0
0.3636
0.3636
0.2121
Bacteria
1.0
0.2121
0.7879**
Fungi
1.0
0.3030
Total
1.0
Station 4
Actinomycetes
1.0
0.4S49*
0.3939
0.4849*
Bacteria
1.0
0.3636
1.0000**
Fungi
1.0
0.3636
Total
1.0
Estuarine biotope
Actinomycetes
1.0
0.333
0.333
0.333
Fungi
1.0
0.333
0.333
Bacteria
1.0
1.000*
Total
1.0
Table 3 : Rank correlation coefficient matrix (Kendall’s Tau) of microbial populations, taking major groups
in different stations and estuarine biotope as one. (Significant value * p.0.05 ; **-p.0.01).
53
the positive correlation might have been influenced by high organic matter (Rangaswami
et al. 1967 ; Vanderpost and Dutka, 1971). The actinomycetes was significantly negatively
correlated with clay. This is also another interesting observation since earlier reports
showed that clay sediments always contain more microbial population including actinomycetes (Paulraj, 1973). The fungal population was significantly positively correlated
with N/ P ratio and silt. However a significant negative correlation was observed between
fungal population and C/ N ratio. The oceanic variables such as temperature and salinity
vary greatly in nearshore environments where fresh water mixes with seawater. Such
changes in temperature and salinity may affect growth, metabolism and survival of
marine and freshwater bacteria. A good relationship seems to exist between salinity,
temperature and marine bacteria (Stanley and Morita, 1968 ; Cooper and Morita, 1972).
However, such relationship was not noticed in the sediments of Vellar estuary. No
correlation between pH and microbial taxa was reported previously (Rangaswami et al,
1967) and similar observation was made here also.
The result on correlation between numerically dominant microbial groups reveal an
existence of significantly positive correlation among bacteria, actinomycetes and fungi
and TMP in station 1 and station 2 (Table 3). Nevertheless such relationship was not
Actinomycetes
Bacteria
Fungi
Total
Station 1
Actinomycetes
1.0
0.6260**
0.4428*
0.5954**
Bacteria
1.0
0.6970**
0.9697**
Fungi
1.0
0.6666**
Total
1.0
Station 2
Actinomycetes
1.0
0.5455*
0.4849*
0.5455*
Bacteria
1.0
0.5152*
1.0000**
Fungi
1.0
0.5151*
Total
1.0
Station 3
Actinomycetes
1.0
0.3636
0.3636
0.2121
Bacteria
1.0
0.2121
0.7879**
Fungi
1.0
0.3030
Total
1.0
Station 4
Actinomycetes
1.0
0.4S49*
0.3939
0.4849*
Bacteria
1.0
0.3636
1.0000**
Fungi
1.0
0.3636
Total
1.0
Estuarine biotope
Actinomycetes
1.0
0.333
0.333
0.333
Fungi
1.0
0.333
0.333
Bacteria
1.0
1.000*
Total
1.0
Table 3 : Rank correlation coefficient matrix (Kendall’s Tau) of microbial populations, taking major groups
in different stations and estuarine biotope as one. (Significant value * p.0.05 ; **-p.0.01).
53