

phosphorus and sediment composition were estimated and related to the microbial
fractions by a series of correlation coefficient matrices (Kendall’s Tau). Results show that
significant correlations between different factors and microbial taxa were not evident in
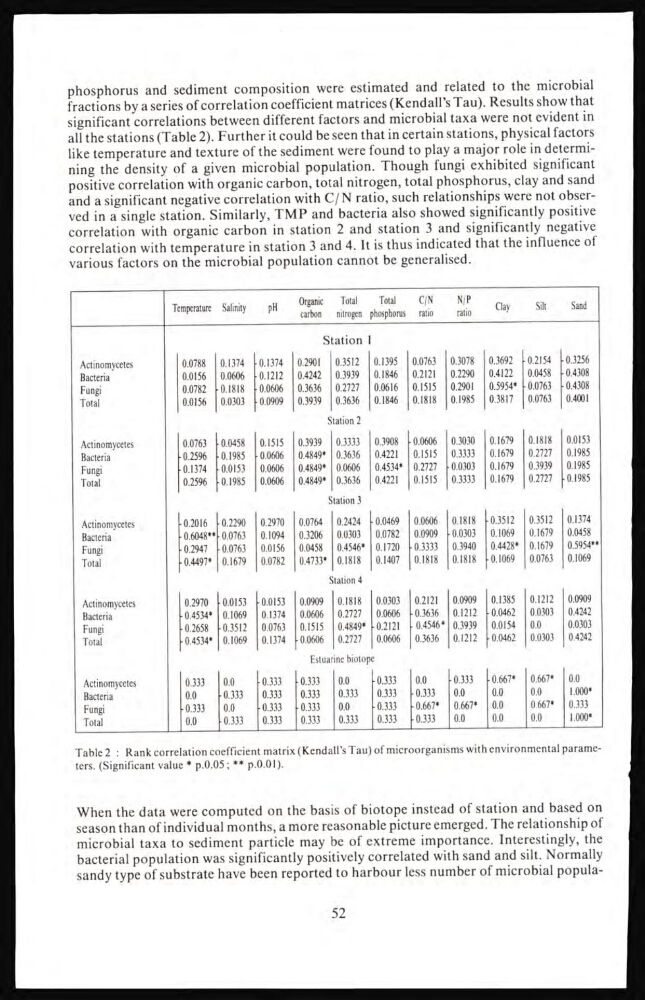
all the stations (Table 2). Further it could be seen that in certain stations, physical factors
like temperature and texture of the sediment were found to play a major role in determining the density of a given microbial population. Though fungi exhibited significant
positive correlation with organic carbon, total nitrogen, total phosphorus, clay and sand
and a significant negative correlation with C/ N ratio, such relationships were not observed in a single station. Similarly, TMP and bacteria also showed significantly positive
correlation with organic carbon in station 2 and station 3 and significantly negative
correlation with temperature in station 3 and 4. It is thus indicated that the influence of
various factors on the microbial population cannot be generalised.
Temperature Salinity
pH
Organic
carbon
Total
nitrogen
Total
phosphorus
C/N
ratio
N/P
ratio
Clay
Silt
Sand
Station 1
Actinomycetes
0.0788 0.1374 0.1374 0.2901 0.3512 0.1395 0.0763 0.3078 0.3692 0.2154 0.3256
Bacteria
0.0156 0.0606 0.1212 0.4242 0.3939 0.1846 0.2121 0.2290 0.4122 0.0458 0.4308
Fungi
0.0782 0.1818 0.0606 0.3636 0.2727 0.0616 0.1515 0.2901
0.5954* 0.0763 0.4308
Total
0.0156 0.0303 0.0909 0.3939 0.3636 0.1846 0.1818 0.1985 0.3817 0.0763 0.4001
Station 2
Actinomycetes
0.0763 0.0458 0.1515 0.3939 0.3333 0.3908 0.0606 0.3030 0.1679 0.1818 0.0153
Bacteria
0.2596 0.1985 0.0606 0.4849* 0.3636 0.4221
0.1515 0.3333 0.1679 0.2727 0.1985
Fungi
0.1374 0.0153 0.0606 0.4849* 0.0606 0.4534* 0.2727 0.0303 0.1679 0.3939 0.1985
Total
0.2596 0.1985 0.0606 0.4849* 0.3636 0.4221
0.1515 0.3333 0.1679 0.2727 -0.1985
Station 3
Actinomycetes
-0.2016 0.2290 0.2970 0.0764 0.2424 0.0469 0.0606 0.1818 0.3512 0.3512 0.1374
Bacteria
0.6048** 0.0763 0.1094 0.3206 0.0303 0.0782 0.0909 0.0303 0.1069 0.1679 0.0458
Fungi
-0.2947 0.0763 0.0156 0.0458 0.4546* 0.1720 0.3333 0.3940 0.4428* 0.1679 0.5954**
Total
. 0.4497* 0.1679 0.0782 0.4733* 0.1818 0.1407 0.1818 0.1818 - 0.1069 0.0763 0.1069
Station 4
Actinomycetes
0.2970 0.0153 0.0153 0.0909 0.1818 0.0303 0.2121 0.0909 0.1385 0.1212 0.0909
Bacteria
- 0.4534* 0.1069 0.1374 0.0606 0.2727 0.0606 0.3636 0.1212 ■ 0.0462 0.0303 0.4242
Fungi
■0.2658 -0.3512 0.0763 0.1515 0.4849* - 0.2121 - 0.4546* 0.3939 0.0154 0.0
0.0303
Total
■ 0.4534* 0.1069 0.1374 - 0.0606 0.2727 0.0606 0.3636 0.1212 ■0.0462 0.0303 0.4242
Estuarine biotope
Actinomycetes
0.333
0.0
0.333
0.333
0.0
0.333
0.0
■0.333
0.667* 0.667* 0.0
Bacteria
0.0
■0.333
0.333
0.333
0.333
0.333
■0.333
0.0
0.0
0.0
1.000*
Fungi
0.333
0.0
-0.333
■0.333
0.0
0.333
■ 0.667* 0.667* 0.0
0.667* 0.333
Total
0.0
■ 0.333
0.333
0.333
0.333
0.333 ■0.333
0.0
0.0
0.0
1.000*
Table 2 : Rank correlation coefficient matrix (Kendall’s Tau) of microorganisms with environmental parameters. (Significant value * p.0.05 ; ** p.0.01).
When the data were computed on the basis of biotope instead of station and based on
season than of individual months, a more reasonable picture emerged. The relationship of
microbial taxa to sediment particle may be of extreme importance. Interestingly, the
bacterial population was significantly positively correlated with sand and silt. Normally
sandy type of substrate have been reported to harbour less number of microbial popula52
fractions by a series of correlation coefficient matrices (Kendall’s Tau). Results show that
significant correlations between different factors and microbial taxa were not evident in
all the stations (Table 2). Further it could be seen that in certain stations, physical factors
like temperature and texture of the sediment were found to play a major role in determining the density of a given microbial population. Though fungi exhibited significant
positive correlation with organic carbon, total nitrogen, total phosphorus, clay and sand
and a significant negative correlation with C/ N ratio, such relationships were not observed in a single station. Similarly, TMP and bacteria also showed significantly positive
correlation with organic carbon in station 2 and station 3 and significantly negative
correlation with temperature in station 3 and 4. It is thus indicated that the influence of
various factors on the microbial population cannot be generalised.
Temperature Salinity
pH
Organic
carbon
Total
nitrogen
Total
phosphorus
C/N
ratio
N/P
ratio
Clay
Silt
Sand
Station 1
Actinomycetes
0.0788 0.1374 0.1374 0.2901 0.3512 0.1395 0.0763 0.3078 0.3692 0.2154 0.3256
Bacteria
0.0156 0.0606 0.1212 0.4242 0.3939 0.1846 0.2121 0.2290 0.4122 0.0458 0.4308
Fungi
0.0782 0.1818 0.0606 0.3636 0.2727 0.0616 0.1515 0.2901
0.5954* 0.0763 0.4308
Total
0.0156 0.0303 0.0909 0.3939 0.3636 0.1846 0.1818 0.1985 0.3817 0.0763 0.4001
Station 2
Actinomycetes
0.0763 0.0458 0.1515 0.3939 0.3333 0.3908 0.0606 0.3030 0.1679 0.1818 0.0153
Bacteria
0.2596 0.1985 0.0606 0.4849* 0.3636 0.4221
0.1515 0.3333 0.1679 0.2727 0.1985
Fungi
0.1374 0.0153 0.0606 0.4849* 0.0606 0.4534* 0.2727 0.0303 0.1679 0.3939 0.1985
Total
0.2596 0.1985 0.0606 0.4849* 0.3636 0.4221
0.1515 0.3333 0.1679 0.2727 -0.1985
Station 3
Actinomycetes
-0.2016 0.2290 0.2970 0.0764 0.2424 0.0469 0.0606 0.1818 0.3512 0.3512 0.1374
Bacteria
0.6048** 0.0763 0.1094 0.3206 0.0303 0.0782 0.0909 0.0303 0.1069 0.1679 0.0458
Fungi
-0.2947 0.0763 0.0156 0.0458 0.4546* 0.1720 0.3333 0.3940 0.4428* 0.1679 0.5954**
Total
. 0.4497* 0.1679 0.0782 0.4733* 0.1818 0.1407 0.1818 0.1818 - 0.1069 0.0763 0.1069
Station 4
Actinomycetes
0.2970 0.0153 0.0153 0.0909 0.1818 0.0303 0.2121 0.0909 0.1385 0.1212 0.0909
Bacteria
- 0.4534* 0.1069 0.1374 0.0606 0.2727 0.0606 0.3636 0.1212 ■ 0.0462 0.0303 0.4242
Fungi
■0.2658 -0.3512 0.0763 0.1515 0.4849* - 0.2121 - 0.4546* 0.3939 0.0154 0.0
0.0303
Total
■ 0.4534* 0.1069 0.1374 - 0.0606 0.2727 0.0606 0.3636 0.1212 ■0.0462 0.0303 0.4242
Estuarine biotope
Actinomycetes
0.333
0.0
0.333
0.333
0.0
0.333
0.0
■0.333
0.667* 0.667* 0.0
Bacteria
0.0
■0.333
0.333
0.333
0.333
0.333
■0.333
0.0
0.0
0.0
1.000*
Fungi
0.333
0.0
-0.333
■0.333
0.0
0.333
■ 0.667* 0.667* 0.0
0.667* 0.333
Total
0.0
■ 0.333
0.333
0.333
0.333
0.333 ■0.333
0.0
0.0
0.0
1.000*
Table 2 : Rank correlation coefficient matrix (Kendall’s Tau) of microorganisms with environmental parameters. (Significant value * p.0.05 ; ** p.0.01).
When the data were computed on the basis of biotope instead of station and based on
season than of individual months, a more reasonable picture emerged. The relationship of
microbial taxa to sediment particle may be of extreme importance. Interestingly, the
bacterial population was significantly positively correlated with sand and silt. Normally
sandy type of substrate have been reported to harbour less number of microbial popula52