

Station
Number of bacteria ml" 1
U.S.N.S. Lynch
9
8.2 (1.9) x 10 5
11
7.3 (2.8) x 10 5
15
1.3 (0.3) x 10 6
18
1.8 (0.6) x 10 6
R/V Gyre
4
2.4 (1.0) x 10 8
Table 1 : Total direct bacterial count at each station enumerated as acridine
orange direct counts (AODC).
Scanning electron micrographs showed the bacterial population to be composed mainly
of small coccoid forms, <1 µm in diameter. The cells were observed to be free, in clumps,
and attached to particles. When grown on a nutrient-rich artificial seawater medium, the
majority of the cells assumed a short rod shape although a few cocci were still present.
Hydrogen production.
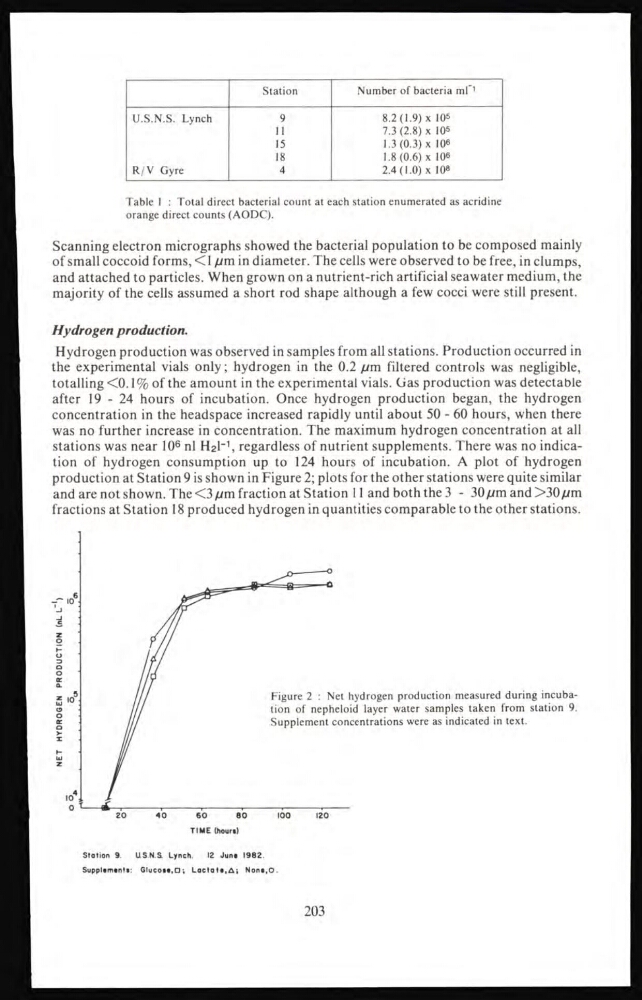
Hydrogen production was observed in samples from all stations. Production occurred in
the experimental vials only; hydrogen in the 0.2 pm filtered controls was negligible,
totalling <0.1% of the amount in the experimental vials. Gas production was detectable
after 19-24 hours of incubation. Once hydrogen production began, the hydrogen
concentration in the headspace increased rapidly until about 50 - 60 hours, when there
was no further increase in concentration. The maximum hydrogen concentration at all
stations was near 10 6 nl H 2 l -1 , regardless of nutrient supplements. There was no indication of hydrogen consumption up to 124 hours of incubation. A plot of hydrogen
production at Station 9 is shown in Figure 2; plots for the other stations were quite similar
and are not shown. The <3 pm fraction at Station 11 and both the 3 - 30 µm and >30 µm
fractions at Station 18 produced hydrogen in quantities comparable to the other stations.
TIME (hour.)
Station 9.
US.N.S. Lynch.
12 June 1982.
Supplements: Glucose, O ; Lactate, A; None, O.
203
Number of bacteria ml" 1
U.S.N.S. Lynch
9
8.2 (1.9) x 10 5
11
7.3 (2.8) x 10 5
15
1.3 (0.3) x 10 6
18
1.8 (0.6) x 10 6
R/V Gyre
4
2.4 (1.0) x 10 8
Table 1 : Total direct bacterial count at each station enumerated as acridine
orange direct counts (AODC).
Scanning electron micrographs showed the bacterial population to be composed mainly
of small coccoid forms, <1 µm in diameter. The cells were observed to be free, in clumps,
and attached to particles. When grown on a nutrient-rich artificial seawater medium, the
majority of the cells assumed a short rod shape although a few cocci were still present.
Hydrogen production.
Hydrogen production was observed in samples from all stations. Production occurred in
the experimental vials only; hydrogen in the 0.2 pm filtered controls was negligible,
totalling <0.1% of the amount in the experimental vials. Gas production was detectable
after 19-24 hours of incubation. Once hydrogen production began, the hydrogen
concentration in the headspace increased rapidly until about 50 - 60 hours, when there
was no further increase in concentration. The maximum hydrogen concentration at all
stations was near 10 6 nl H 2 l -1 , regardless of nutrient supplements. There was no indication of hydrogen consumption up to 124 hours of incubation. A plot of hydrogen
production at Station 9 is shown in Figure 2; plots for the other stations were quite similar
and are not shown. The <3 pm fraction at Station 11 and both the 3 - 30 µm and >30 µm
fractions at Station 18 produced hydrogen in quantities comparable to the other stations.
TIME (hour.)
Station 9.
US.N.S. Lynch.
12 June 1982.
Supplements: Glucose, O ; Lactate, A; None, O.
203