

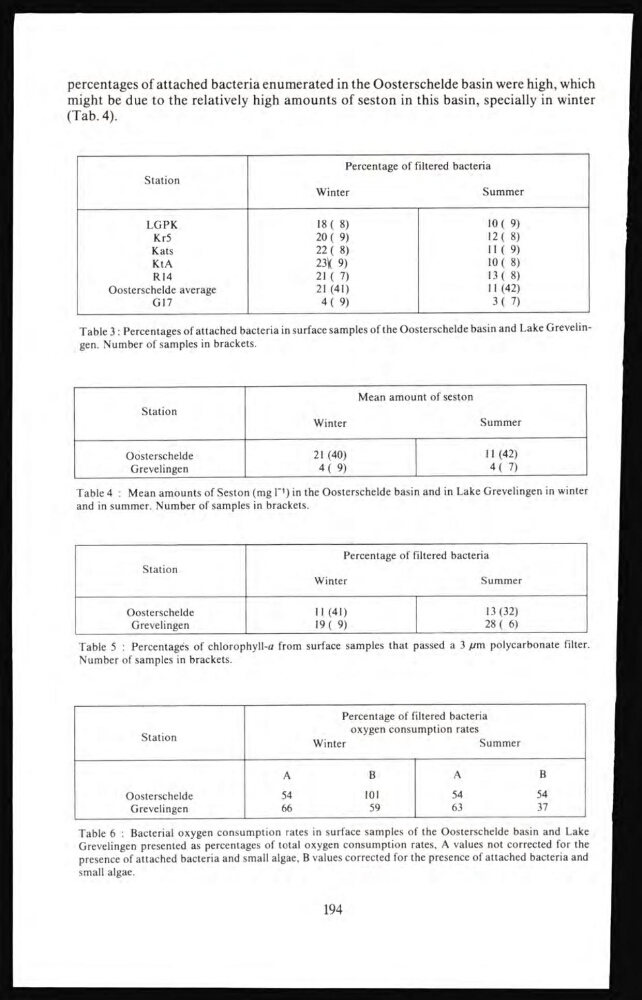
percentages of attached bacteria enumerated in the Oosterschelde basin were high, which
might be due to the relatively high amounts of seston in this basin, specially in winter
(Tab. 4).
Station
Percentage of filtered bacteria
Winter
Summer
LGPK
18 ( 8)
10 ( 9)
Kr5
20 ( 9)
12 ( 8)
Kats
22 ( 8)
11(9)
KtA
23 ( 9)
10 ( 8)
R14
21 ( 7)
13 ( 8)
Oosterschelde average
21 (41)
11 (42)
G17
4 ( 9)
3 ( 7)
Table 3 : Percentages of attached bacteria in surface samples of the Oosterschelde basin and Lake Grevehngen. Number of samples in brackets.
Mean amount of seston
Station
Winter
Summer
Oosterschelde
21 (40)
11 (42)
Grevelingen
4 ( 9)
4 ( 7)
Table 4 : Mean amounts of Seston (mg P) in the Oosterschelde basin and in Lake Grevelingen in winter
and in summer. Number of samples in brackets.
Percentage of filtered bacteria
Station
Winter
Summer
Oosterschelde
11 (41)
13 (32)
Grevelingen
19 ( 9)
28 ( 6)
Table 5 : Percentages of chlorophyll-a from surface samples that passed a 3 µm polycarbonate filter.
Number of samples in brackets.
Station
Percentage of filtered bacteria
oxygen consumption rates
Winter
Summer
Oosterschelde
Grevelingen
A
B
54
101
66
59
A
B
54
54
63
37
Table 6 : Bacterial oxygen consumption rates in surface samples of the Oosterschelde basin and Lake
Grevelingen presented as percentages of total oxygen consumption rates, A values not corrected for the
presence of attached bacteria and small algae, B values corrected for the presence of attached bacteria and
small algae.
194
might be due to the relatively high amounts of seston in this basin, specially in winter
(Tab. 4).
Station
Percentage of filtered bacteria
Winter
Summer
LGPK
18 ( 8)
10 ( 9)
Kr5
20 ( 9)
12 ( 8)
Kats
22 ( 8)
11(9)
KtA
23 ( 9)
10 ( 8)
R14
21 ( 7)
13 ( 8)
Oosterschelde average
21 (41)
11 (42)
G17
4 ( 9)
3 ( 7)
Table 3 : Percentages of attached bacteria in surface samples of the Oosterschelde basin and Lake Grevehngen. Number of samples in brackets.
Mean amount of seston
Station
Winter
Summer
Oosterschelde
21 (40)
11 (42)
Grevelingen
4 ( 9)
4 ( 7)
Table 4 : Mean amounts of Seston (mg P) in the Oosterschelde basin and in Lake Grevelingen in winter
and in summer. Number of samples in brackets.
Percentage of filtered bacteria
Station
Winter
Summer
Oosterschelde
11 (41)
13 (32)
Grevelingen
19 ( 9)
28 ( 6)
Table 5 : Percentages of chlorophyll-a from surface samples that passed a 3 µm polycarbonate filter.
Number of samples in brackets.
Station
Percentage of filtered bacteria
oxygen consumption rates
Winter
Summer
Oosterschelde
Grevelingen
A
B
54
101
66
59
A
B
54
54
63
37
Table 6 : Bacterial oxygen consumption rates in surface samples of the Oosterschelde basin and Lake
Grevelingen presented as percentages of total oxygen consumption rates, A values not corrected for the
presence of attached bacteria and small algae, B values corrected for the presence of attached bacteria and
small algae.
194