

Station
Percentage of oxygen consumption
Winter
Summer
LGPK
51 ( 8)
54 ( 9)
Kr5
90 ( 9)
75 ( 7)
Rats
35 ( 8)
34 ( 8)
KtA
46 ( 9)
65 ( 7)
R14
40 ( 7)
46 ( 8)
Oosterschelde average
54 (41)
54 (39)
G17
66 ( 9)
63 ( 7)
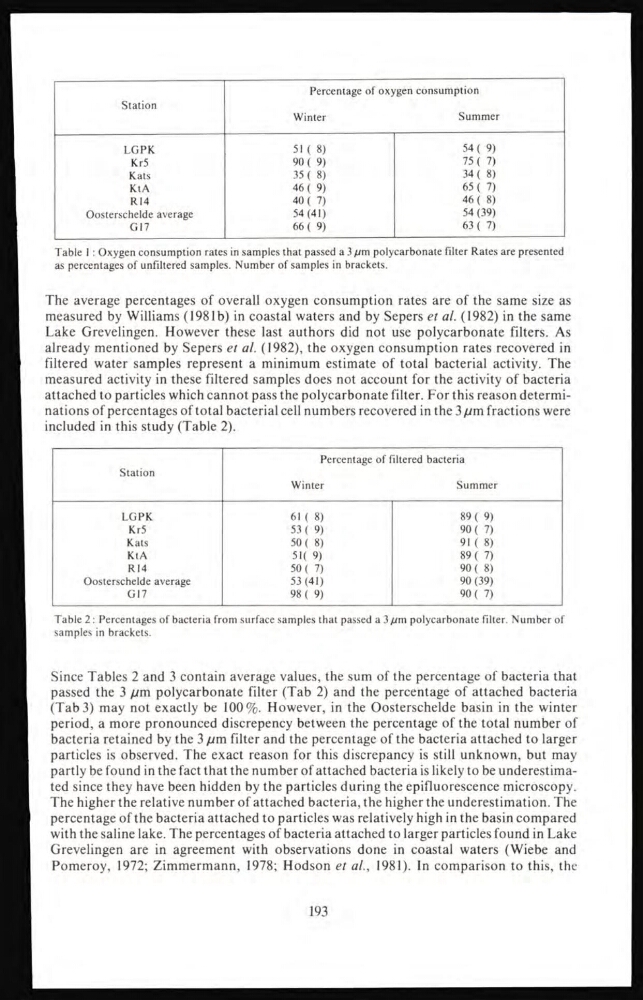
Table 1 : Oxygen consumption rates in samples that passed a 3 pm polycarbonate filter Rates are presented
as percentages of unfiltered samples. Number of samples in brackets.
The average percentages of overall oxygen consumption rates are of the same size as
measured by Williams (1981b) in coastal waters and by Sepers et al. (1982) in the same
Lake Grevelingen. However these last authors did not use polycarbonate filters. As
already mentioned by Sepers et al. (1982), the oxygen consumption rates recovered in
filtered water samples represent a minimum estimate of total bacterial activity. The
measured activity in these filtered samples does not account for the activity of bacteria
attached to particles which cannot pass the polycarbonate filter. For this reason determinations of percentages of total bacterial cell numbers recovered in the 3 µm fractions were
included in this study (Table 2).
Station
Percentage of filtered bacteria
Winter
Summer
LGPK
61 ( 8)
89 ( 9)
Kr5
53 ( 9)
90 ( 7)
Kats
50 ( 8)
91 ( 8)
KtA
51 ( 9)
89 ( 7)
R14
50 ( 7)
90 ( 8)
Oosterschelde average
53 (41)
90 (39)
G17
98 ( 9)
90 ( 7)
Table 2 : Percentages of bacteria from surface samples that passed a 3 µm polycarbonate filter. Number of
samples in brackets.
Since Tables 2 and 3 contain average values, the sum of the percentage of bacteria that
passed the 3 µm polycarbonate filter (Tab 2) and the percentage of attached bacteria
(Tab 3) may not exactly be 100%. However, in the Oosterschelde basin in the winter
period, a more pronounced discrepency between the percentage of the total number of
bacteria retained by the 3 µm filter and the percentage of the bacteria attached to larger
particles is observed. The exact reason for this discrepancy is still unknown, but may
partly be found in the fact that the number of attached bacteria is likely to be underestimated since they have been hidden by the particles during the epifluorescence microscopy.
The higher the relative number of attached bacteria, the higher the underestimation. The
percentage of the bacteria attached to particles was relatively high in the basin compared
with the saline lake. The percentages of bacteria attached to larger particles found in Lake
Grevelingen are in agreement with observations done in coastal waters (Wiebe and
Pomeroy, 1972; Zimmermann, 1978; Hodson et al., 1981). In comparison to this, the
193
Percentage of oxygen consumption
Winter
Summer
LGPK
51 ( 8)
54 ( 9)
Kr5
90 ( 9)
75 ( 7)
Rats
35 ( 8)
34 ( 8)
KtA
46 ( 9)
65 ( 7)
R14
40 ( 7)
46 ( 8)
Oosterschelde average
54 (41)
54 (39)
G17
66 ( 9)
63 ( 7)
Table 1 : Oxygen consumption rates in samples that passed a 3 pm polycarbonate filter Rates are presented
as percentages of unfiltered samples. Number of samples in brackets.
The average percentages of overall oxygen consumption rates are of the same size as
measured by Williams (1981b) in coastal waters and by Sepers et al. (1982) in the same
Lake Grevelingen. However these last authors did not use polycarbonate filters. As
already mentioned by Sepers et al. (1982), the oxygen consumption rates recovered in
filtered water samples represent a minimum estimate of total bacterial activity. The
measured activity in these filtered samples does not account for the activity of bacteria
attached to particles which cannot pass the polycarbonate filter. For this reason determinations of percentages of total bacterial cell numbers recovered in the 3 µm fractions were
included in this study (Table 2).
Station
Percentage of filtered bacteria
Winter
Summer
LGPK
61 ( 8)
89 ( 9)
Kr5
53 ( 9)
90 ( 7)
Kats
50 ( 8)
91 ( 8)
KtA
51 ( 9)
89 ( 7)
R14
50 ( 7)
90 ( 8)
Oosterschelde average
53 (41)
90 (39)
G17
98 ( 9)
90 ( 7)
Table 2 : Percentages of bacteria from surface samples that passed a 3 µm polycarbonate filter. Number of
samples in brackets.
Since Tables 2 and 3 contain average values, the sum of the percentage of bacteria that
passed the 3 µm polycarbonate filter (Tab 2) and the percentage of attached bacteria
(Tab 3) may not exactly be 100%. However, in the Oosterschelde basin in the winter
period, a more pronounced discrepency between the percentage of the total number of
bacteria retained by the 3 µm filter and the percentage of the bacteria attached to larger
particles is observed. The exact reason for this discrepancy is still unknown, but may
partly be found in the fact that the number of attached bacteria is likely to be underestimated since they have been hidden by the particles during the epifluorescence microscopy.
The higher the relative number of attached bacteria, the higher the underestimation. The
percentage of the bacteria attached to particles was relatively high in the basin compared
with the saline lake. The percentages of bacteria attached to larger particles found in Lake
Grevelingen are in agreement with observations done in coastal waters (Wiebe and
Pomeroy, 1972; Zimmermann, 1978; Hodson et al., 1981). In comparison to this, the
193