

evening or midnight, to the morning or noon, by as much as three times in the 5 m layer,
and then decreased gradually from the morning or noon to the evening. It is supposed that
the decrease in the concentration of vitamins in the photosynthetic layer during the
daytime, must be attributed to the consumption of vitamins by phytoplankton requiring
vitamins. On the other hand, the increase in the concentration of vitamins must be caused
by the surplus of the autochthonous production of vitamins by microorganisms. During
the investigative period, stagnation of water was observed during very fine clam weather,
without any water turbulence. Therefore, it is considered that the successive variation in
the concentration of vitamins showed a tendency to repeate this pattern over 30 hours,
because of the elimination of the supply of allochthonous sources of vitamins.
Secondarily, in order to clarify the relationship between the consumption and production
of vitamins in water without water movement, and the allochthonous supply of vitamins,
the variation in the concentration of vitamins in water of closed systems was examined
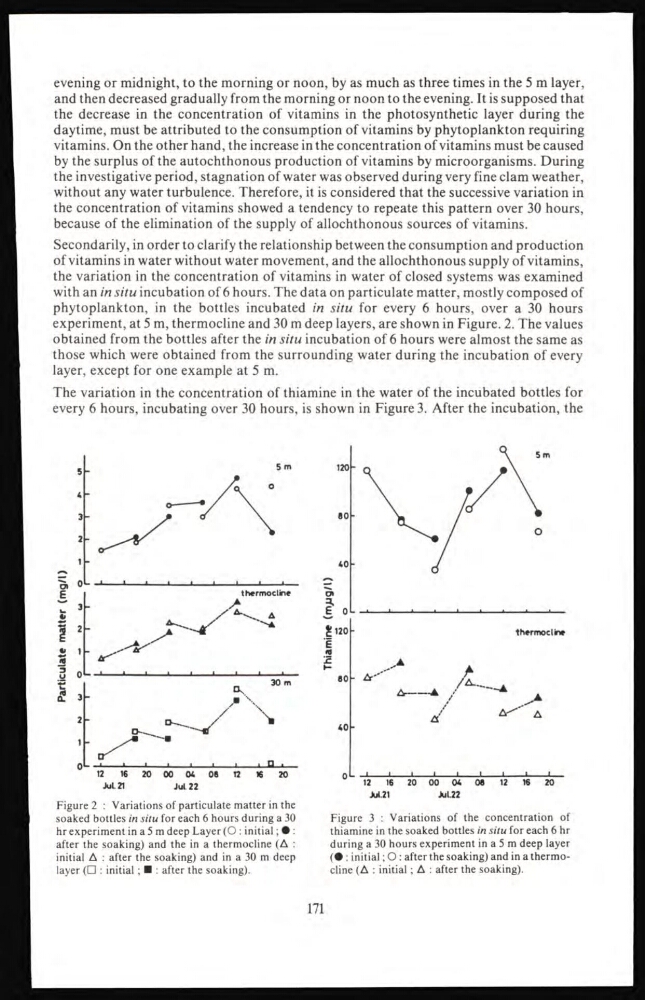
with an in situ incubation of 6 hours. The data on particulate matter, mostly composed of
phytoplankton, in the bottles incubated in situ for every 6 hours, over a 30 hours
experiment, at 5 m, thermocline and 30 m deep layers, are shown in Figure. 2. The values
obtained from the bottles after the in situ incubation of 6 hours were almost the same as
those which were obtained from the surrounding water during the incubation of every
layer, except for one example at 5 m.
The variation in the concentration of thiamine in the water of the incubated bottles for
every 6 hours, incubating over 30 hours, is shown in Figure 3. After the incubation, the
Figure 2 : Variations of particulate matter in the
soaked bottles in situ for each 6 hours during a 30
hr experiment in a 5 m deep Layer (O : initial ; • :
after the soaking) and the in a thermocline (A :
initial A : after the soaking) and in a 30 m deep
layer (□ : initial ; ■ : after the soaking).
Figure 3 : Variations of the concentration of
thiamine in the soaked bottles in situ for each 6 hr
during a 30 hours experiment in a 5 m deep layer
(• : initial ; O : after the soaking) and in a thermocline (A : initial ; A : after the soaking).
171
and then decreased gradually from the morning or noon to the evening. It is supposed that
the decrease in the concentration of vitamins in the photosynthetic layer during the
daytime, must be attributed to the consumption of vitamins by phytoplankton requiring
vitamins. On the other hand, the increase in the concentration of vitamins must be caused
by the surplus of the autochthonous production of vitamins by microorganisms. During
the investigative period, stagnation of water was observed during very fine clam weather,
without any water turbulence. Therefore, it is considered that the successive variation in
the concentration of vitamins showed a tendency to repeate this pattern over 30 hours,
because of the elimination of the supply of allochthonous sources of vitamins.
Secondarily, in order to clarify the relationship between the consumption and production
of vitamins in water without water movement, and the allochthonous supply of vitamins,
the variation in the concentration of vitamins in water of closed systems was examined
with an in situ incubation of 6 hours. The data on particulate matter, mostly composed of
phytoplankton, in the bottles incubated in situ for every 6 hours, over a 30 hours
experiment, at 5 m, thermocline and 30 m deep layers, are shown in Figure. 2. The values
obtained from the bottles after the in situ incubation of 6 hours were almost the same as
those which were obtained from the surrounding water during the incubation of every
layer, except for one example at 5 m.
The variation in the concentration of thiamine in the water of the incubated bottles for
every 6 hours, incubating over 30 hours, is shown in Figure 3. After the incubation, the
Figure 2 : Variations of particulate matter in the
soaked bottles in situ for each 6 hours during a 30
hr experiment in a 5 m deep Layer (O : initial ; • :
after the soaking) and the in a thermocline (A :
initial A : after the soaking) and in a 30 m deep
layer (□ : initial ; ■ : after the soaking).
Figure 3 : Variations of the concentration of
thiamine in the soaked bottles in situ for each 6 hr
during a 30 hours experiment in a 5 m deep layer
(• : initial ; O : after the soaking) and in a thermocline (A : initial ; A : after the soaking).
171