

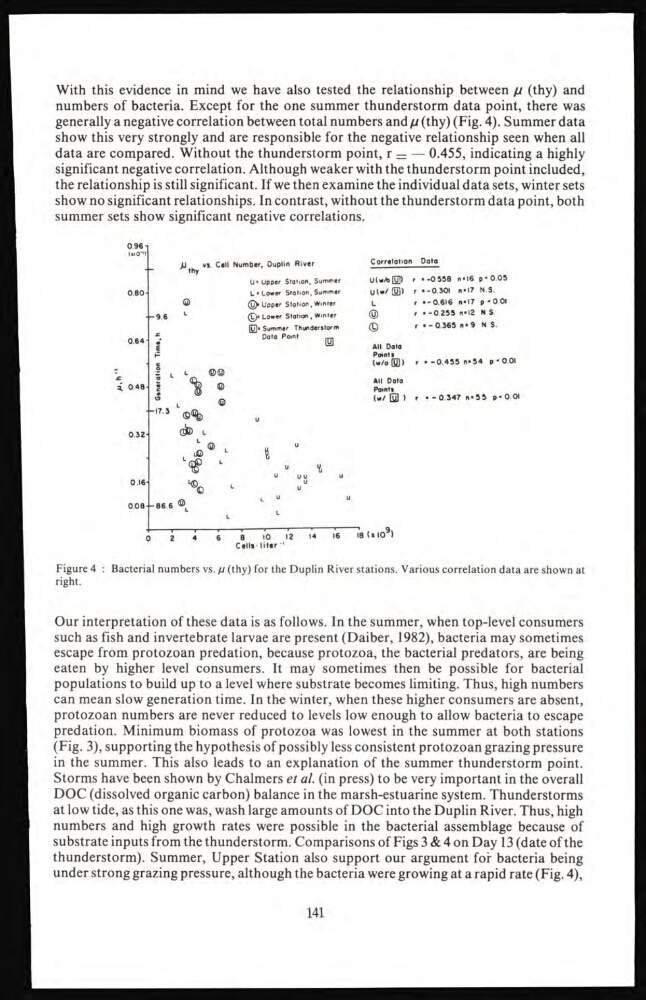
With this evidence in mind we have also tested the relationship between µ (thy) and
numbers of bacteria. Except for the one summer thunderstorm data point, there was
generally a negative correlation between total numbers and µ (thy) (Fig. 4). Summer data
show this very strongly and are responsible for the negative relationship seen when all
data are compared. Without the thunderstorm point, r — — 0.455, indicating a highly
significant negative correlation. Although weaker with the thunderstorm point included,
the relationship is still significant. If we then examine the individual data sets, winter sets
show no significant relationships. In contrast, without the thunderstorm data point, both
summer sets show significant negative correlations.
Correlation Data
U = Upper Stotion, Summer
U(w/o U) r .-0 558 n • 16 » < 0.05
L = Lower Station, Summer
U(w/ 0) r • -0.301 n=l7 N S.
(y^ Upper Station, Winter
L
r • - 0.616 n=l7 p < 0 01
(L)» Lower Station , Winter
©
' • -0.255 n=12 M S.
0* Summer Thunderstorm
©
«-0.365 n * 9 N S.
Data Point
^
All Data
Points
(w/o E) ) r = -0.455 n= 54 p ■ 0 01
All Data
Points
(w/ G2 ) r • - 0347 n=55 p < 0.01
Figure 4 : Bacterial numbers vs. µ (thy) for the Duplin River stations. Various correlation data are shown at
right.
Our interpretation of these data is as follows. In the summer, when top-level consumers
such as fish and invertebrate larvae are present (Daiber, 1982), bacteria may sometimes
escape from protozoan predation, because protozoa, the bacterial predators, are being
eaten by higher level consumers. It may sometimes then be possible for bacterial
populations to build up to a level where substrate becomes limiting. Thus, high numbers
can mean slow generation time. In the winter, when these higher consumers are absent,
protozoan numbers are never reduced to levels low enough to allow bacteria to escape
predation. Minimum biomass of protozoa was lowest in the summer at both stations
(Fig. 3), supporting the hypothesis of possibly less consistent protozoan grazing pressure
in the summer. This also leads to an explanation of the summer thunderstorm point.
Storms have been shown by Chalmers et al. (in press) to be very important in the overall
DOC (dissolved organic carbon) balance in the marsh-estuarine system. Thunderstorms
at low tide, as this one was, wash large amounts of DOC into the Duplin River. Thus, high
numbers and high growth rates were possible in the bacterial assemblage because of
substrate inputs from the thunderstorm. Comparisons of Figs 3 & 4 on Day 13 (date of the
thunderstorm). Summer, Upper Station also support our argument for bacteria being
under strong grazing pressure, although the bacteria were growing at a rapid rate (Fig. 4),
141
numbers of bacteria. Except for the one summer thunderstorm data point, there was
generally a negative correlation between total numbers and µ (thy) (Fig. 4). Summer data
show this very strongly and are responsible for the negative relationship seen when all
data are compared. Without the thunderstorm point, r — — 0.455, indicating a highly
significant negative correlation. Although weaker with the thunderstorm point included,
the relationship is still significant. If we then examine the individual data sets, winter sets
show no significant relationships. In contrast, without the thunderstorm data point, both
summer sets show significant negative correlations.
Correlation Data
U = Upper Stotion, Summer
U(w/o U) r .-0 558 n • 16 » < 0.05
L = Lower Station, Summer
U(w/ 0) r • -0.301 n=l7 N S.
(y^ Upper Station, Winter
L
r • - 0.616 n=l7 p < 0 01
(L)» Lower Station , Winter
©
' • -0.255 n=12 M S.
0* Summer Thunderstorm
©
«-0.365 n * 9 N S.
Data Point
^
All Data
Points
(w/o E) ) r = -0.455 n= 54 p ■ 0 01
All Data
Points
(w/ G2 ) r • - 0347 n=55 p < 0.01
Figure 4 : Bacterial numbers vs. µ (thy) for the Duplin River stations. Various correlation data are shown at
right.
Our interpretation of these data is as follows. In the summer, when top-level consumers
such as fish and invertebrate larvae are present (Daiber, 1982), bacteria may sometimes
escape from protozoan predation, because protozoa, the bacterial predators, are being
eaten by higher level consumers. It may sometimes then be possible for bacterial
populations to build up to a level where substrate becomes limiting. Thus, high numbers
can mean slow generation time. In the winter, when these higher consumers are absent,
protozoan numbers are never reduced to levels low enough to allow bacteria to escape
predation. Minimum biomass of protozoa was lowest in the summer at both stations
(Fig. 3), supporting the hypothesis of possibly less consistent protozoan grazing pressure
in the summer. This also leads to an explanation of the summer thunderstorm point.
Storms have been shown by Chalmers et al. (in press) to be very important in the overall
DOC (dissolved organic carbon) balance in the marsh-estuarine system. Thunderstorms
at low tide, as this one was, wash large amounts of DOC into the Duplin River. Thus, high
numbers and high growth rates were possible in the bacterial assemblage because of
substrate inputs from the thunderstorm. Comparisons of Figs 3 & 4 on Day 13 (date of the
thunderstorm). Summer, Upper Station also support our argument for bacteria being
under strong grazing pressure, although the bacteria were growing at a rapid rate (Fig. 4),
141