

Function and metabolism
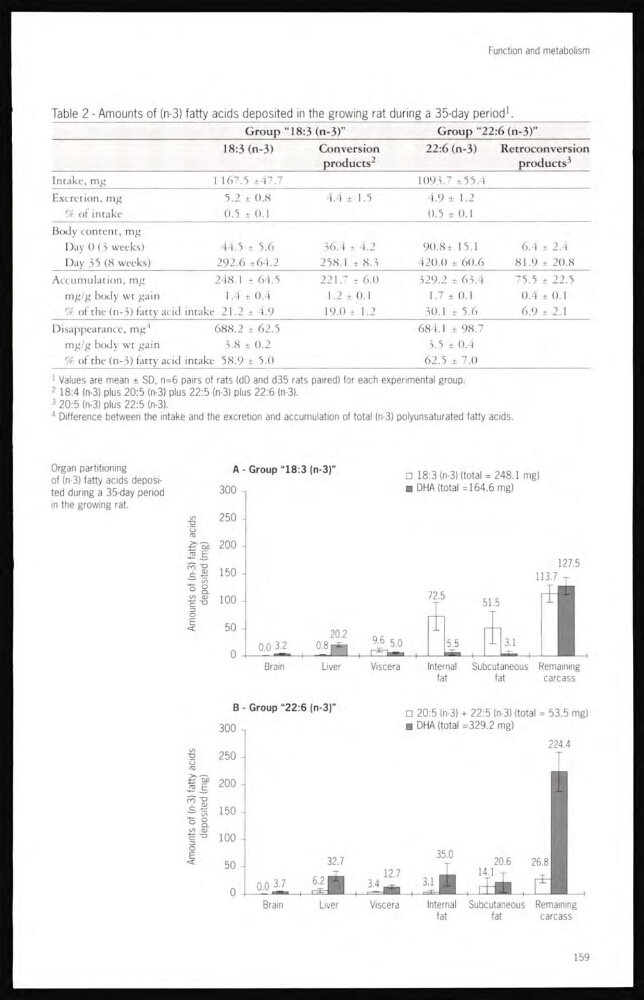
Table 2 - Amounts of (n-3) fatty acids deposited in the growing rat during a 35-day period 1 .
Group “18:3 (n-3)’’
Group “22:6 (n-3)”
18:3 (n-3)
Conversion
products
2
22:6 (n-3)
Retroconversion
products
3
Intake, mg
1167.5 ± 47.7
1093.7 ± 55.4
Excretion, mg
5.2 ± 0.8
4.4 ± 1.5
4.9 ± 1.2
% of intake
0.5 ± 0.1
0.5 ± 0.1
Body content, mg
Day 0 (3 weeks)
44.5 ± 5.6
36.4 ± 4.2
90,8±15.1
6.4± 2.4
Day 35 (8 weeks)
292.6 ±64.2
258.1 ± 8.1
420.0 ± 60.6
81.9 ± 20.8
Accumulation, mg
248.1 ± 64.5
221.7 ± 0.0
329.2 ± 63.4
75.5 ± 22.5
mg/g body wt gain
1.4 ± 0.4
1.2 ± 0.1
1.7 ± 0.1
0.4 ± 0.1
% of the (n-3) fatty acid intake 21.2 ± 4.9
19.0 ± 1.2
30.1 ± 5.0
6.9 ± 2.1
Disappearance, mg 4
688.2 ± 62.5
684.l ± 98.7
mg/g body wt gain
3.8 ± 0.2
3.5 ± 0.4
% of the (n-3) fatty acid intake 58.9 ± 5.0
62.5 ± 7.0
1 Values are mean ± SD, n=6 pairs of rats (dO and d35 rats paired) for each experimental group.
2 18:4 (n-3) plus 20:5 (n-3) plus 22:5 (n-3) plus 22:6 (n-3).
3 20:5 (n-3) plus 22:5 (n-3).
4 Difference between the intake and the excretion and accumulation of total (n-3) polyunsaturated fatty acids.
A - Group “18:3 (n-3)”
□ 18:3 (n-3) (total = 248.1 mg)
□ DHA (total =164.6 mg)
Organ partitioning
of (n-3) fatty aclds deposited during a 35-day period
in the growing rat.
B - Group “22:6 (n-3)”
□ 20:5 (n-3) + 22:5 (n-3) (total = 53.5 mg)
□ DHA (total =329.2 mg)
159
Table 2 - Amounts of (n-3) fatty acids deposited in the growing rat during a 35-day period 1 .
Group “18:3 (n-3)’’
Group “22:6 (n-3)”
18:3 (n-3)
Conversion
products
2
22:6 (n-3)
Retroconversion
products
3
Intake, mg
1167.5 ± 47.7
1093.7 ± 55.4
Excretion, mg
5.2 ± 0.8
4.4 ± 1.5
4.9 ± 1.2
% of intake
0.5 ± 0.1
0.5 ± 0.1
Body content, mg
Day 0 (3 weeks)
44.5 ± 5.6
36.4 ± 4.2
90,8±15.1
6.4± 2.4
Day 35 (8 weeks)
292.6 ±64.2
258.1 ± 8.1
420.0 ± 60.6
81.9 ± 20.8
Accumulation, mg
248.1 ± 64.5
221.7 ± 0.0
329.2 ± 63.4
75.5 ± 22.5
mg/g body wt gain
1.4 ± 0.4
1.2 ± 0.1
1.7 ± 0.1
0.4 ± 0.1
% of the (n-3) fatty acid intake 21.2 ± 4.9
19.0 ± 1.2
30.1 ± 5.0
6.9 ± 2.1
Disappearance, mg 4
688.2 ± 62.5
684.l ± 98.7
mg/g body wt gain
3.8 ± 0.2
3.5 ± 0.4
% of the (n-3) fatty acid intake 58.9 ± 5.0
62.5 ± 7.0
1 Values are mean ± SD, n=6 pairs of rats (dO and d35 rats paired) for each experimental group.
2 18:4 (n-3) plus 20:5 (n-3) plus 22:5 (n-3) plus 22:6 (n-3).
3 20:5 (n-3) plus 22:5 (n-3).
4 Difference between the intake and the excretion and accumulation of total (n-3) polyunsaturated fatty acids.
A - Group “18:3 (n-3)”
□ 18:3 (n-3) (total = 248.1 mg)
□ DHA (total =164.6 mg)
Organ partitioning
of (n-3) fatty aclds deposited during a 35-day period
in the growing rat.
B - Group “22:6 (n-3)”
□ 20:5 (n-3) + 22:5 (n-3) (total = 53.5 mg)
□ DHA (total =329.2 mg)
159