

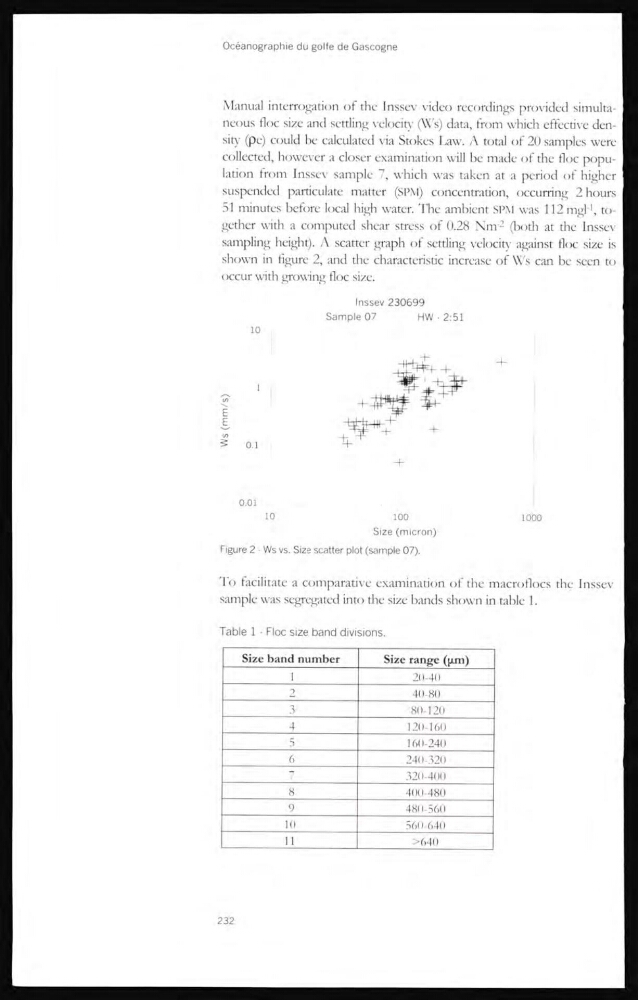
Manual interrogation of the Inssey video recordings provided simultaneous floc size and settling velocity (Ws) data, from which effective density (pe) could be calculated via Stokes Law. /\ total of 20 samples were
collected, however a closer examination will be made of the floc population from Inssey- sample 7, which was taken at a period of higher
suspended particulate matter (SPM) concentration, occurring 2 hours
51 minutes before local high water. The ambient SPM was 112 mgl
-1 , together with a computed shear stress of 0.28 Nm -2 (both at the Inssev
sampling height). A scatter graph of settling velocity against floc size is
shown in figure 2, and the characteristic increase of Ws can be seen to
occurwith growing floc size.
Figure 2 - Ws vs. Size scatter plot (sample 07).
To facilitate a comparative examination of the macroflocs the Inssev
sample was segregated into the size bands shown in table 1.
Table 1 - Floc size band divisions.
Size band number
Size range (gm)
1
20-40
2
40-80
3
80-120
4
120 160
5
160 240
6
240-320
7
320 400
8
400-480
9
480 560
10
560-640
1 1
> 640
232
collected, however a closer examination will be made of the floc population from Inssey- sample 7, which was taken at a period of higher
suspended particulate matter (SPM) concentration, occurring 2 hours
51 minutes before local high water. The ambient SPM was 112 mgl
-1 , together with a computed shear stress of 0.28 Nm -2 (both at the Inssev
sampling height). A scatter graph of settling velocity against floc size is
shown in figure 2, and the characteristic increase of Ws can be seen to
occurwith growing floc size.
Figure 2 - Ws vs. Size scatter plot (sample 07).
To facilitate a comparative examination of the macroflocs the Inssev
sample was segregated into the size bands shown in table 1.
Table 1 - Floc size band divisions.
Size band number
Size range (gm)
1
20-40
2
40-80
3
80-120
4
120 160
5
160 240
6
240-320
7
320 400
8
400-480
9
480 560
10
560-640
1 1
> 640
232