

Le milieu marin : planctonologie
"Early spring" 1993
cells >20µm
3%
cells > 20µm
1. 50%
"Late spring'' 1994
"Mid-spring" 1995
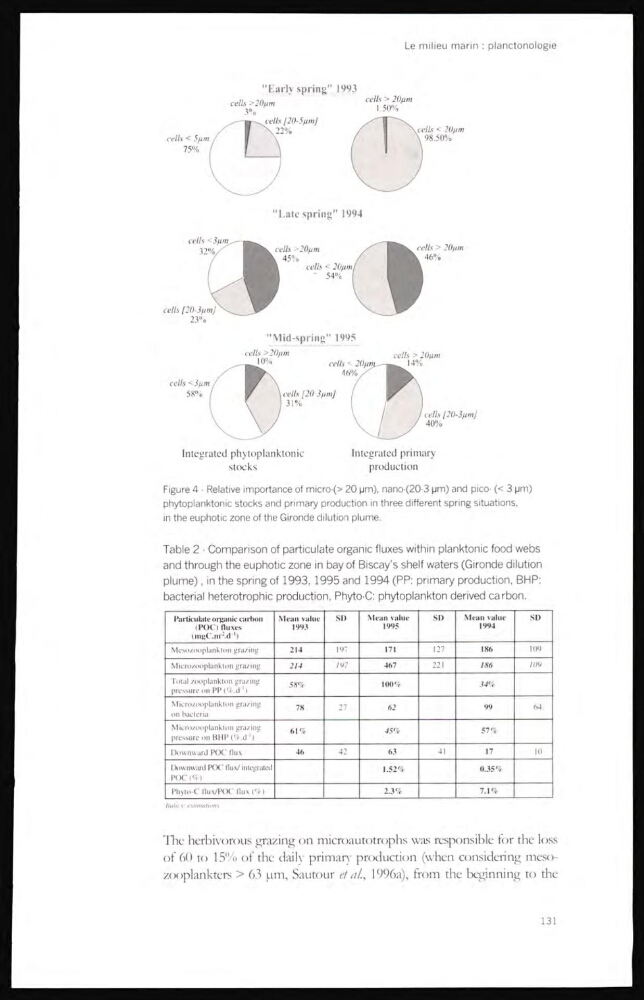
Figure 4 - Relative importance of micro-(> 20 pm), nano-(20-3 pm) and pico- (< 3 pm)
phytoplanktonic stocks and primary production in three different spring situations,
in the euphotic zone of the Gironde dilution plume.
Table 2 - Comparison of particulate organic fluxes within planktonic food webs
and through the euphotic zone in bay of Biscay’s shelf waters (Gironde dilution
plume), in the spring of 1993, 1995 and 1994 (PP: primary production, BPIP:
bacterial heterotrophic production, Phyto-C: phytoplankton derived carbon.
Particulate organic carbon
(POC) fluxes
1993
SD
Mean value
1995
SD
Mean value
1994
SD
Mesozooplankton grazing
214
197
171
127
186
109
Microzooplankton grazing
214
197
467
221
186
109
Total zooplankton grazing
pressure on PP (%.d'’)
58%
100%
34%
Microzooplankton grazing
on bacteria
78
27
62
99
64
Microzooplankton grazing
pressure on BHP (%.d ')
61%
45%
57%
Downward POC Ilux
46
42
63
41
17
10
Downward POC tlux/ integrated
POC (%)
1.52%
0.35%
Phyto-C flux/POC flux (%)
2.3%
7.1%
Italics: estimations
The herbivorous grazing on microautotrophs was responsiblc for the loss
of 60 to 15% of the daily primary production (when considering mesozooplankters > 63 pm, Sautour etal, 1996a), from the beginning to the
131
"Early spring" 1993
cells >20µm
3%
cells > 20µm
1. 50%
"Late spring'' 1994
"Mid-spring" 1995
Figure 4 - Relative importance of micro-(> 20 pm), nano-(20-3 pm) and pico- (< 3 pm)
phytoplanktonic stocks and primary production in three different spring situations,
in the euphotic zone of the Gironde dilution plume.
Table 2 - Comparison of particulate organic fluxes within planktonic food webs
and through the euphotic zone in bay of Biscay’s shelf waters (Gironde dilution
plume), in the spring of 1993, 1995 and 1994 (PP: primary production, BPIP:
bacterial heterotrophic production, Phyto-C: phytoplankton derived carbon.
Particulate organic carbon
(POC) fluxes
1993
SD
Mean value
1995
SD
Mean value
1994
SD
Mesozooplankton grazing
214
197
171
127
186
109
Microzooplankton grazing
214
197
467
221
186
109
Total zooplankton grazing
pressure on PP (%.d'’)
58%
100%
34%
Microzooplankton grazing
on bacteria
78
27
62
99
64
Microzooplankton grazing
pressure on BHP (%.d ')
61%
45%
57%
Downward POC Ilux
46
42
63
41
17
10
Downward POC tlux/ integrated
POC (%)
1.52%
0.35%
Phyto-C flux/POC flux (%)
2.3%
7.1%
Italics: estimations
The herbivorous grazing on microautotrophs was responsiblc for the loss
of 60 to 15% of the daily primary production (when considering mesozooplankters > 63 pm, Sautour etal, 1996a), from the beginning to the
131