

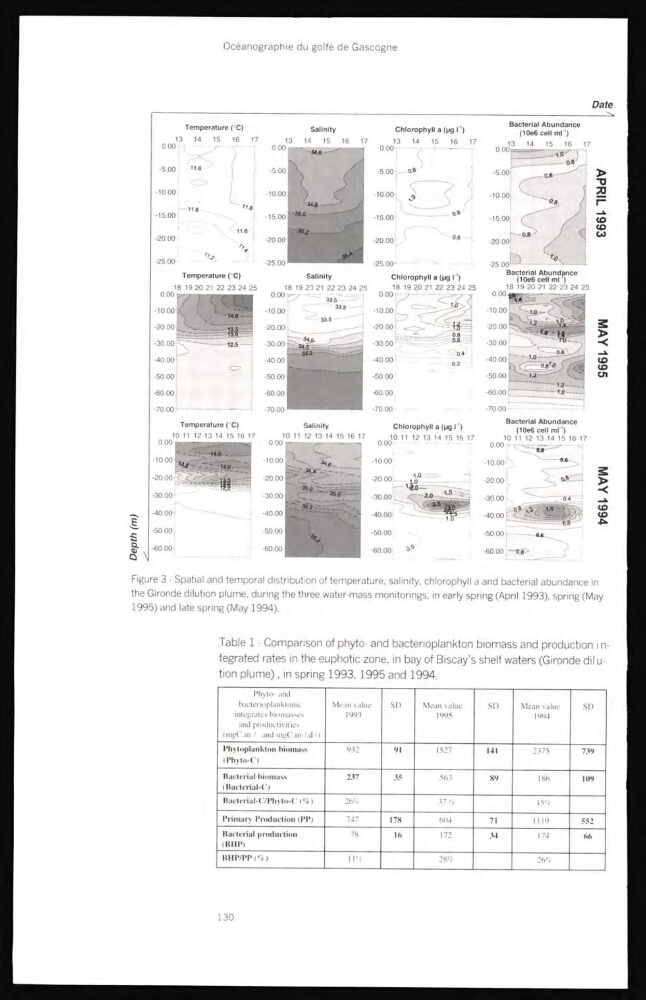
Figure 3 - Spatial and temporal distribution of temperature, salinity, chlorophyll a and bacterial abundance in
the Gironde dilution plume, during the three water-mass monitorings, in early spring (April 1993), spring (May
1995) and late spring(May 1994).
Table 1 - Comparison of phyto- and bacterioplankton biomass and production i ntegrated rates in the euphotic zone, in bay of Biscay’s shelf waters (Gironde dil ution plume), in spring 1993, 1995 and 1994.
Phyto- and
bacterioplanktonic
integrates biomasses
and productivities
(mgC.m-2 and mgC. m2.d-1)
Mean value
1993
SD
Mean value
1995
SD
Mean value
1994
SD
Phytoplankton biomass
(Phyto-C)
932
91
1527
141
2375
739
Bacterial biomass
(Bacterial-C)
237
35
563
89
186
109
Bacterial-C/Phyto-C (%)
26%
37 %
15%
Primary Production (PP)
747
178
604
71
1119
552
Bactcrial production
(BHP)
78
16
172
34
174
66
BHP/PP (%)
11%
28%
26%
130
the Gironde dilution plume, during the three water-mass monitorings, in early spring (April 1993), spring (May
1995) and late spring(May 1994).
Table 1 - Comparison of phyto- and bacterioplankton biomass and production i ntegrated rates in the euphotic zone, in bay of Biscay’s shelf waters (Gironde dil ution plume), in spring 1993, 1995 and 1994.
Phyto- and
bacterioplanktonic
integrates biomasses
and productivities
(mgC.m-2 and mgC. m2.d-1)
Mean value
1993
SD
Mean value
1995
SD
Mean value
1994
SD
Phytoplankton biomass
(Phyto-C)
932
91
1527
141
2375
739
Bacterial biomass
(Bacterial-C)
237
35
563
89
186
109
Bacterial-C/Phyto-C (%)
26%
37 %
15%
Primary Production (PP)
747
178
604
71
1119
552
Bactcrial production
(BHP)
78
16
172
34
174
66
BHP/PP (%)
11%
28%
26%
130