

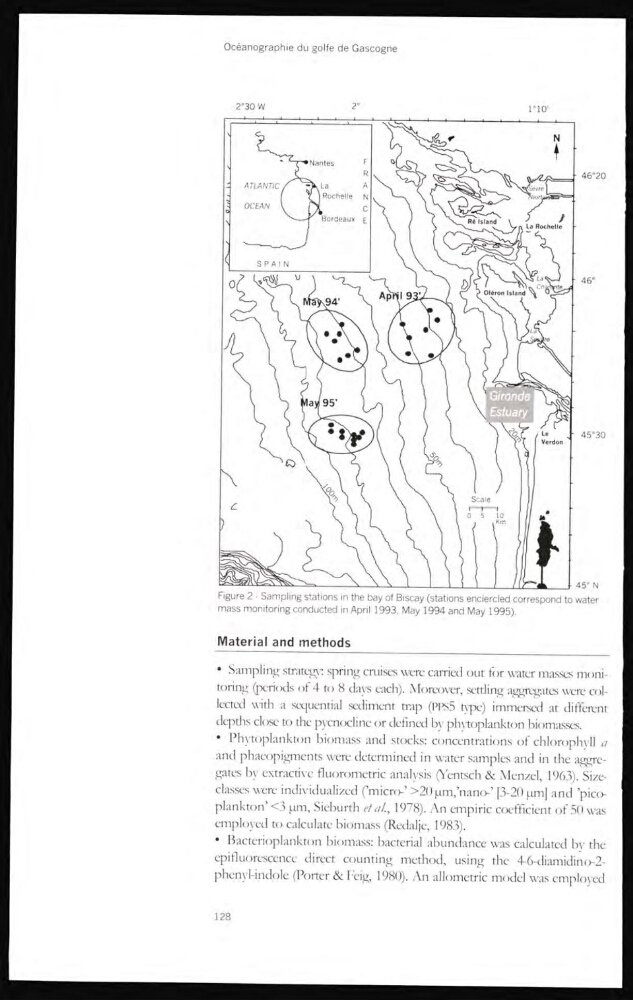
Figure 2 - Sampling stations in the bay of Biscay (stations enciercled correspond to water
mass monitoring conducted in April 1993, May 1994 and May 1995),
Material and methods
• Sampling strategic spring cruises were carrial out for water masses monitoring (periods of 4 to 8 days each). Moreover, settling tiggregates were collected with a sequential sediment trap (PPS5 npe-) immersed at different
depths close to the pycnocline or defined by phyto «plankton biomasses.
• Phytoplankton biomass and stocks: concentrations of chlorophyll a
and phaeopigments were determined in water samples and in the aggregates by extractive fluorometric analvsis (Yentsch & Menzel, 1963). Sizeclasses were individualized (’micro-’ >20 µm,’nano-’ [3-20 gm] and ’pico
plankton <3 pm, Sieburth et a!, 1978). An empiric coefficient of 30was
employed to calculate biomass (Redalje, 1983).
Bacterioplankton biomass: bacterial abundance was calculated by the
epifluorescence direct counting method, using the 4-6-diamidino-2phenyl-indole (Porter & Feig, 19811). An allometric model was employed
128
mass monitoring conducted in April 1993, May 1994 and May 1995),
Material and methods
• Sampling strategic spring cruises were carrial out for water masses monitoring (periods of 4 to 8 days each). Moreover, settling tiggregates were collected with a sequential sediment trap (PPS5 npe-) immersed at different
depths close to the pycnocline or defined by phyto «plankton biomasses.
• Phytoplankton biomass and stocks: concentrations of chlorophyll a
and phaeopigments were determined in water samples and in the aggregates by extractive fluorometric analvsis (Yentsch & Menzel, 1963). Sizeclasses were individualized (’micro-’ >20 µm,’nano-’ [3-20 gm] and ’pico
plankton <3 pm, Sieburth et a!, 1978). An empiric coefficient of 30was
employed to calculate biomass (Redalje, 1983).
Bacterioplankton biomass: bacterial abundance was calculated by the
epifluorescence direct counting method, using the 4-6-diamidino-2phenyl-indole (Porter & Feig, 19811). An allometric model was employed
128