

Environmental and resource applications
Water samples were taken by teachers and pupils, which allowed us to
estimate TSM fluxes and particulate organic carbon fluxes for about
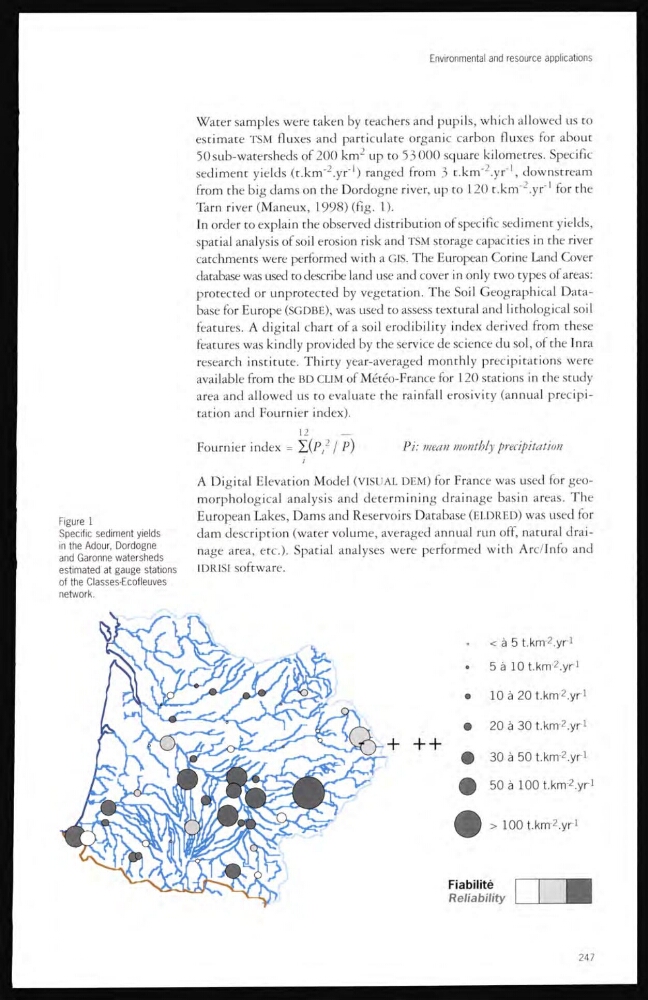
50sub-watersheds of 200 km 2 up to 53 000 square kilometres. Specific
sediment yields (t.km
-2 .yr - 1 ) ranged from 3 t.km" 2 .yr _ 1 , downstream
from the big dams on the Dordogne river, up to 120 t.km - 2 .yr -1 for the
Tarn river (Maneux, 1998) (fig. 1).
In order to explain the observed distribution of specific sediment yields,
spatial analysis of soil erosion risk and TSM storage capacities m the river
catchments were pertormed with a GIS. The European Corine Land Cover
database was used to describe land use and cover in only two types of areas:
protected or unprotected by vegetation. The Soil Geographical Database for Europe (SGDBE), was used to assess textural and lithological soil
features. A digital chart of a soil erodibility index derived from these
features was kindly provided by the service de science du sol, of the Inra
research institute. Thirty year-averaged monthly precipitations were
available from the BD CLIM of Météo-France for 120 stations in the study
area and allowed us to evaluate the rainfall erosivity (annual precipitation and Fournier index).
12
_
Fournier index = L(f’
;
2 / P)
Pi.' mean monthly precipitation
Figure 1
Specific sediment yields
in the Adour, Dordogne
and Garonne watersheds
estimated at gauge stations
of the Classes-Ecofleuves
network.
A Digital Elevation Model (VISUAL DEM) for France was used for geomorphological analysis and determining drainage basin areas. The
European Lakes, Dams and Reservoirs Database (ELDRED) was used for
dam description (water volume, averaged annual run off, natural drainage area, etc.). Spatial analyses were performed with Arc/Info and
IDRISI software.
247
Water samples were taken by teachers and pupils, which allowed us to
estimate TSM fluxes and particulate organic carbon fluxes for about
50sub-watersheds of 200 km 2 up to 53 000 square kilometres. Specific
sediment yields (t.km
-2 .yr - 1 ) ranged from 3 t.km" 2 .yr _ 1 , downstream
from the big dams on the Dordogne river, up to 120 t.km - 2 .yr -1 for the
Tarn river (Maneux, 1998) (fig. 1).
In order to explain the observed distribution of specific sediment yields,
spatial analysis of soil erosion risk and TSM storage capacities m the river
catchments were pertormed with a GIS. The European Corine Land Cover
database was used to describe land use and cover in only two types of areas:
protected or unprotected by vegetation. The Soil Geographical Database for Europe (SGDBE), was used to assess textural and lithological soil
features. A digital chart of a soil erodibility index derived from these
features was kindly provided by the service de science du sol, of the Inra
research institute. Thirty year-averaged monthly precipitations were
available from the BD CLIM of Météo-France for 120 stations in the study
area and allowed us to evaluate the rainfall erosivity (annual precipitation and Fournier index).
12
_
Fournier index = L(f’
;
2 / P)
Pi.' mean monthly precipitation
Figure 1
Specific sediment yields
in the Adour, Dordogne
and Garonne watersheds
estimated at gauge stations
of the Classes-Ecofleuves
network.
A Digital Elevation Model (VISUAL DEM) for France was used for geomorphological analysis and determining drainage basin areas. The
European Lakes, Dams and Reservoirs Database (ELDRED) was used for
dam description (water volume, averaged annual run off, natural drainage area, etc.). Spatial analyses were performed with Arc/Info and
IDRISI software.
247