

CoastGIS'99: geomatics and coastal environment
Statistical parameters for the description
of the morphological development
Changes of depth are conventionally expressed by retreating or progressing isolines. Regressions and correlation coefficients are calculated
to express and underline the assumed trend. However, because of the
described inaccuracies in sea survey data, the position of an isoline on
a map representing the relatively flat sea ground is not very reliable.
Another way to describe changes in depth are profiles. The limited
usefulness of such profiles to describe data accuracy has been discussed
in the previous chapter.
Statistical parameters can be calculated for any area like grid cells of
any size or morphological units like ebb tidal deltas, any part of the
seaground or tidal basin. A small area leads to a more differentiated
result, however, it is disturbed by a higher noise level (fig.7, S). A central
problem for any work with sea survey data is the identification and
elimination of incorrect data. For this work, locally differentiated
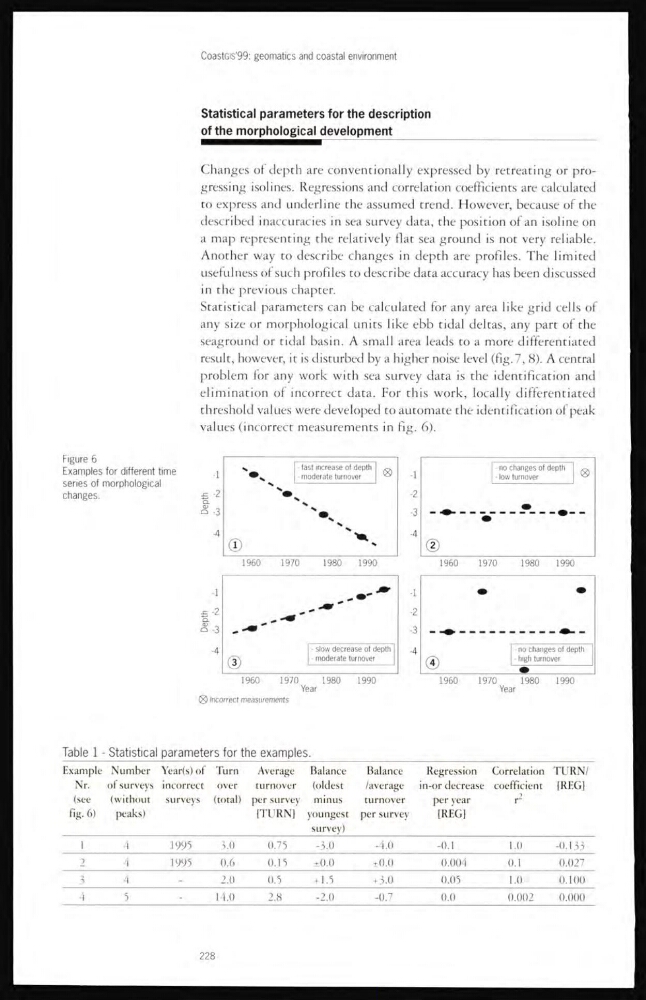
threshold values were developed to automate the identification of peak
values (incorrect measurements in fig. 6).
Figure 6
Examples for different time
series of morphological
changes.
Table 1 - Statistical parameters for the examples.
Example
Nr.
(see
fig. 6)
Number
of surveys
(without
peaks)
Year(s) of
incorrect
surveys
Turn
over
(total)
Average
turnover
per survey
[TURN]
Balance
(oldest
minus
youngest
survey)
Balance
/average
turnover
per survey
Regression
in-or decrease
per year
[REG]
Correlation
coefficient
r2
TURN/
[REG]
1
4
1995
5.0
0.75
-3.0
-4.0
-0.1
1.0
-0.133
2
4
1995
0.6
0.15
±0.0
±0.0
0.00 1
0.1
0.027
3
4
-
2.(1
0.5
±1.5
+ 3.0
0.05
1.0
0.100
4
5
-
14.0
2.8
-2.0
-0.7
0.0
0.002
0.000
228
Statistical parameters for the description
of the morphological development
Changes of depth are conventionally expressed by retreating or progressing isolines. Regressions and correlation coefficients are calculated
to express and underline the assumed trend. However, because of the
described inaccuracies in sea survey data, the position of an isoline on
a map representing the relatively flat sea ground is not very reliable.
Another way to describe changes in depth are profiles. The limited
usefulness of such profiles to describe data accuracy has been discussed
in the previous chapter.
Statistical parameters can be calculated for any area like grid cells of
any size or morphological units like ebb tidal deltas, any part of the
seaground or tidal basin. A small area leads to a more differentiated
result, however, it is disturbed by a higher noise level (fig.7, S). A central
problem for any work with sea survey data is the identification and
elimination of incorrect data. For this work, locally differentiated
threshold values were developed to automate the identification of peak
values (incorrect measurements in fig. 6).
Figure 6
Examples for different time
series of morphological
changes.
Table 1 - Statistical parameters for the examples.
Example
Nr.
(see
fig. 6)
Number
of surveys
(without
peaks)
Year(s) of
incorrect
surveys
Turn
over
(total)
Average
turnover
per survey
[TURN]
Balance
(oldest
minus
youngest
survey)
Balance
/average
turnover
per survey
Regression
in-or decrease
per year
[REG]
Correlation
coefficient
r2
TURN/
[REG]
1
4
1995
5.0
0.75
-3.0
-4.0
-0.1
1.0
-0.133
2
4
1995
0.6
0.15
±0.0
±0.0
0.00 1
0.1
0.027
3
4
-
2.(1
0.5
±1.5
+ 3.0
0.05
1.0
0.100
4
5
-
14.0
2.8
-2.0
-0.7
0.0
0.002
0.000
228