

Environmental and resource applications
The user is presented with an initial front-end which provides access to
screens for altering the sea level rise and population growth assumptions.
The model is then run and maps of flood risk (fig. 4) or population growth
can be displayed. The user is also able to manipulate the front-end to
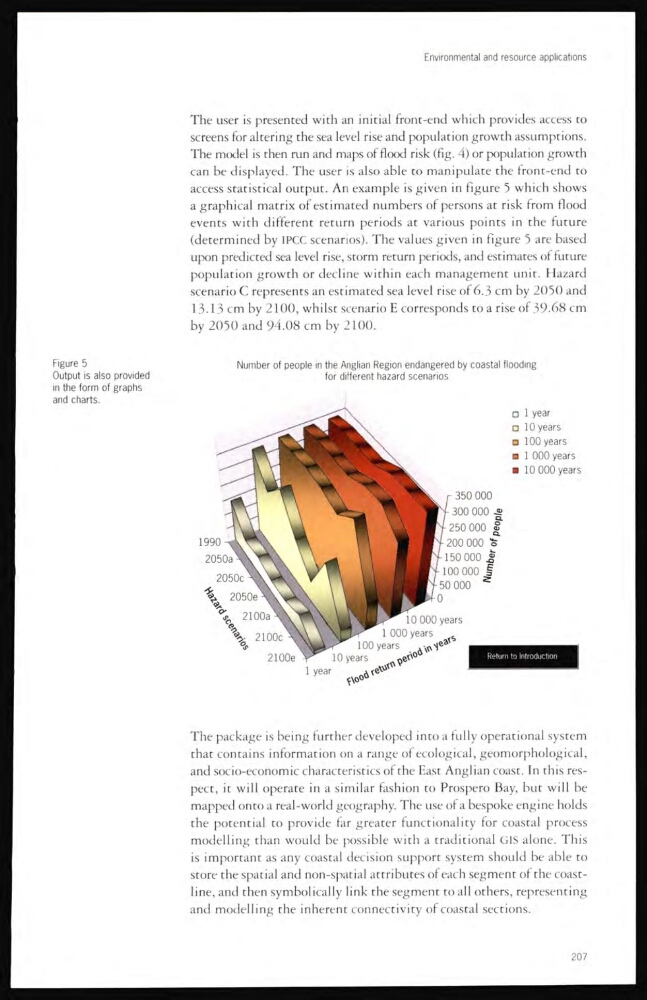
access statistical output. An example is given in figure 5 which shows
a graphical matrix of estimated numbers of persons at risk from flood
events with different return periods at various points in the future
(determined by IPCC scenarios). The values given in figure 5 are based
upon predicted sea level rise, storm return periods, and estimates of future
population growth or decline within each management unit. Hazard
scenario C represents an estimated sea level rise of 6.3 cm by 2050 and
13.13 cm by 2100, whilst scenario E corresponds to a rise of 39.68 cm
by 2050 and 94.08 cm by 2100.
Figure 5
Output is also provided
in the form of graphs
and charts.
Number of people in the Anglian Region endangered by coastal flooding
for different hazard scenarios
The package is being further developed into a fully operational system
that contains information on a range of ecological, geomorphological,
and socio-economic characteristics of the East Anglian coast. In this respect, it will operate in a similar fasliion to Prospero Bay, but will be
mapped onto a real-world geography. The use of a bespoke engine holds
the potential to provide far greater functionality for coastal process
modelling than would be possible with a traditional GIS alone. This
is important as any coastal decision support system should be able to
store the spatial and non-spatial attributes of each segment of the coastline, and then symbolically link the segment to all others, representing
and modelling the inherent connectivity of coastal sections.
207
The user is presented with an initial front-end which provides access to
screens for altering the sea level rise and population growth assumptions.
The model is then run and maps of flood risk (fig. 4) or population growth
can be displayed. The user is also able to manipulate the front-end to
access statistical output. An example is given in figure 5 which shows
a graphical matrix of estimated numbers of persons at risk from flood
events with different return periods at various points in the future
(determined by IPCC scenarios). The values given in figure 5 are based
upon predicted sea level rise, storm return periods, and estimates of future
population growth or decline within each management unit. Hazard
scenario C represents an estimated sea level rise of 6.3 cm by 2050 and
13.13 cm by 2100, whilst scenario E corresponds to a rise of 39.68 cm
by 2050 and 94.08 cm by 2100.
Figure 5
Output is also provided
in the form of graphs
and charts.
Number of people in the Anglian Region endangered by coastal flooding
for different hazard scenarios
The package is being further developed into a fully operational system
that contains information on a range of ecological, geomorphological,
and socio-economic characteristics of the East Anglian coast. In this respect, it will operate in a similar fasliion to Prospero Bay, but will be
mapped onto a real-world geography. The use of a bespoke engine holds
the potential to provide far greater functionality for coastal process
modelling than would be possible with a traditional GIS alone. This
is important as any coastal decision support system should be able to
store the spatial and non-spatial attributes of each segment of the coastline, and then symbolically link the segment to all others, representing
and modelling the inherent connectivity of coastal sections.
207