

CoastGIS’99: geomatics and coastal environment
The system combines the coastal flood risk models with information
on projected population growth for each management unit derived
from UK census of population statistics (Openshaw, 1995). At present
it allows users to estimate flood risks in each management unit for any
year up to 2100 based on the Intergovernmental Panel on Climate
Change (IPCC) sea level risk predictions (Houghton et al., 1996). The
user is able to incorporate population growth predictions, and then
estimate the population at risk (in terms of both households and persons) from flooding at any point in the future. Cartographic output is
provided in the form of predicted risk and population maps for management units. The maps are dynamic, and automatically update when
the assumptions of the scenarios change. Statistical functionality is
provided in the form of tables and three dimensional charts.
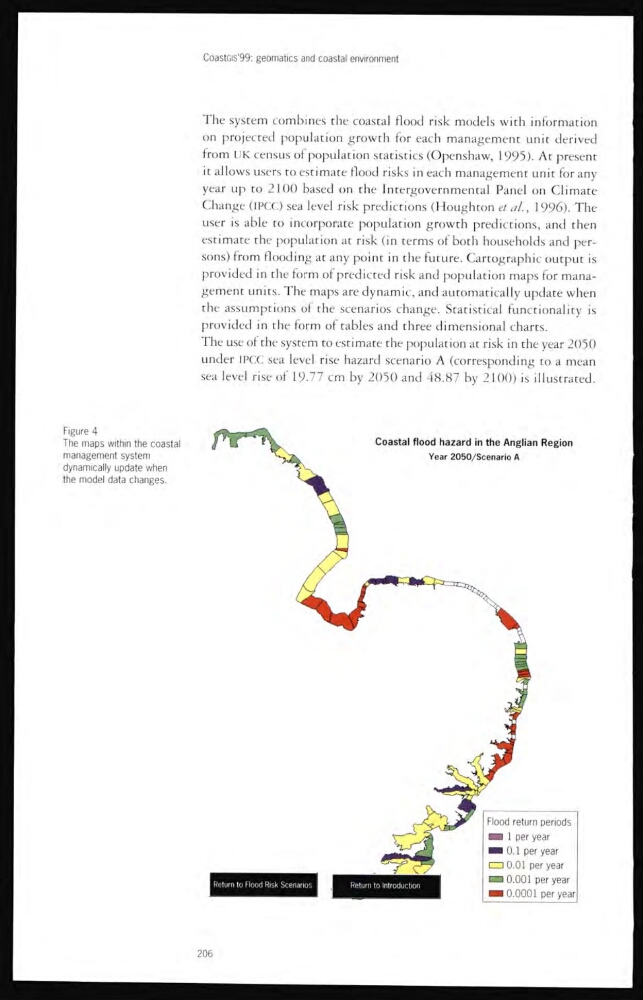
The use of the system to estimate the population at risk m the year 2050
under IPCC sea level rise hazard scenario A (corresponding to a mean
sea level rise of 19.77 cm by 2050 and 48.87 by 2100) is illustrated.
Figure 4
The maps within the coastal
management system
dynamically update when
the model data changes.
206
The system combines the coastal flood risk models with information
on projected population growth for each management unit derived
from UK census of population statistics (Openshaw, 1995). At present
it allows users to estimate flood risks in each management unit for any
year up to 2100 based on the Intergovernmental Panel on Climate
Change (IPCC) sea level risk predictions (Houghton et al., 1996). The
user is able to incorporate population growth predictions, and then
estimate the population at risk (in terms of both households and persons) from flooding at any point in the future. Cartographic output is
provided in the form of predicted risk and population maps for management units. The maps are dynamic, and automatically update when
the assumptions of the scenarios change. Statistical functionality is
provided in the form of tables and three dimensional charts.
The use of the system to estimate the population at risk m the year 2050
under IPCC sea level rise hazard scenario A (corresponding to a mean
sea level rise of 19.77 cm by 2050 and 48.87 by 2100) is illustrated.
Figure 4
The maps within the coastal
management system
dynamically update when
the model data changes.
206