

FISH NUTRITION
423
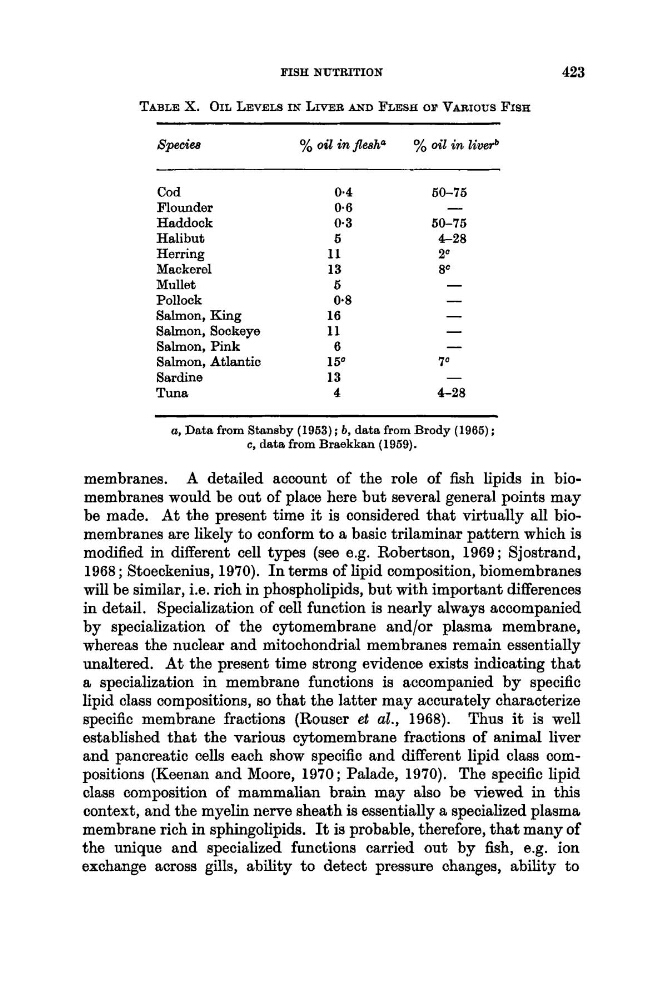
TABLE X. OIL LEVELS M LIVER AND FLESH OP VARIOUS FISH
Specie8
yo oil in flesh"
yo oil in. liverb
Cod
Flounder
Haddock
Halibut
Herring
Mackerel
Mullet
Pollock
Salmon, King
Salmon, Sockeye
Salmon, Pink
Salmon, Atlantic
Sardine
Tuna
0.4
0.6
0- 3
6
11
13
5
0.8
16
11
6
1 5 O
13
4
60-75
50-75
P 2 8
2c
8c
-
a, Data from Stansby (1963) ; b, data from Brody (1966) ;
c, data from Brctekkan (1969).
membranes. A detailed account of the role of fish lipids in biomembranes would be out of place here but several general points may
be made. At the present time it is considered that virtually all biomembranes are likely to conform t o a basic trilaminar pattern which is
modified in different cell types (see e.g. Robertson, 1969; Sjostrand,
1968 ; Stoeckenius, 1970). I n terms of lipid composition, biomembranes
will be similar, i.e. rich in phospholipids, but with important differences
in detail. Specialization of cell function is nearly always accompanied
by specialization of the cytomembrane and/or plasma membrane,
whereas the nuclear and mitochondria1 membranes remain essentially
unaltered. At the present time strong evidence exists indicating that
a specialization in membrane functions is accompanied by specific
lipid class compositions, so that the latter may accurately characterize
specific membrane fractions (Rouser et aZ., 1968). Thus it is well
established that the various cytomembrane fractions of animal liver
and pancreatic cells each show specific and different lipid class compositions (Keenan and Moore, 1970; Palade, 1970). The specific lipid
class composition of mammalian brain may also be viewed in this
context, and the myelin nerve sheath is essentially a specialized plasma
membrane rich in sphingolipids. It is probable, therefore, that many of
the unique and specialized functions carried out by fish, e.g. ion
exchange across gills, ability to detect pressure changes, ability to
423
TABLE X. OIL LEVELS M LIVER AND FLESH OP VARIOUS FISH
Specie8
yo oil in flesh"
yo oil in. liverb
Cod
Flounder
Haddock
Halibut
Herring
Mackerel
Mullet
Pollock
Salmon, King
Salmon, Sockeye
Salmon, Pink
Salmon, Atlantic
Sardine
Tuna
0.4
0.6
0- 3
6
11
13
5
0.8
16
11
6
1 5 O
13
4
60-75
50-75
P 2 8
2c
8c
-
a, Data from Stansby (1963) ; b, data from Brody (1966) ;
c, data from Brctekkan (1969).
membranes. A detailed account of the role of fish lipids in biomembranes would be out of place here but several general points may
be made. At the present time it is considered that virtually all biomembranes are likely to conform t o a basic trilaminar pattern which is
modified in different cell types (see e.g. Robertson, 1969; Sjostrand,
1968 ; Stoeckenius, 1970). I n terms of lipid composition, biomembranes
will be similar, i.e. rich in phospholipids, but with important differences
in detail. Specialization of cell function is nearly always accompanied
by specialization of the cytomembrane and/or plasma membrane,
whereas the nuclear and mitochondria1 membranes remain essentially
unaltered. At the present time strong evidence exists indicating that
a specialization in membrane functions is accompanied by specific
lipid class compositions, so that the latter may accurately characterize
specific membrane fractions (Rouser et aZ., 1968). Thus it is well
established that the various cytomembrane fractions of animal liver
and pancreatic cells each show specific and different lipid class compositions (Keenan and Moore, 1970; Palade, 1970). The specific lipid
class composition of mammalian brain may also be viewed in this
context, and the myelin nerve sheath is essentially a specialized plasma
membrane rich in sphingolipids. It is probable, therefore, that many of
the unique and specialized functions carried out by fish, e.g. ion
exchange across gills, ability to detect pressure changes, ability to