

ASPECTS or STRESS IN THE TROPICAL MARINE ENVIRONMENT
245
maxima for the species, an average ratio of 1 : 1.5 was obtained, and this
was applied as a reasonable correction to the sizes of the deep water
records. Figure 22 shows how the percentage of large species decreased
markedly with increasing depth.
For information on the relation of size to temperature in shallow
species we have drawn on Abbott (1967), Warmke and Abbott (1962)
and Olsson (1961), with some additional data from Greenland waters.
For molluscs from low water to 20 m there were sufficient data to allow
the American Atlantic and Pacific coasts to be treated separately.
The results are shown in Figs. 23 and 24. Both show the highest
30
04
0
10
20
Temperature -‘C
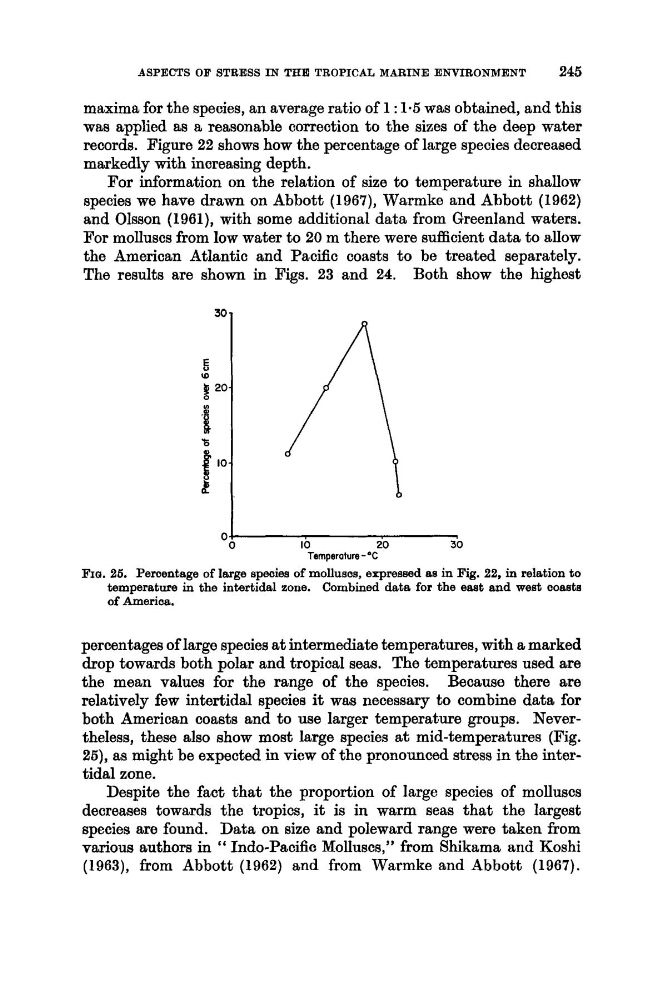
FIQ. 25. Peroentage of large speoies of mollusos, expressed as in Fig. 22, in relation to
temperature in the intertidal zone. Combined data for the east and west ooasta
of Amerioa.
percentages of large species at intermediate temperatures, with a marked
drop towards both polar and tropical seas. The temperatures used are
the mean values for the range of the species. Because there are
relatively few intertidal species it was necessary to combine data for
both American coasts and to use larger temperature groups. Nevertheless, these also show most large species a t mid-temperatures (Fig.
25), as might be expected in view of the pronounced stress in the intertidal zone.
Despite the fact that the proportion of large species of molluscs
decreases towards the tropics, it is in warm seas that the largest
species are found. Data on size and poleward range were taken from
various authors in “ Indo-Pacific Molluscs,” fiom Shikama and Koshi
(1963), from Abbott (1962) and from Warmke and Abbott (1967).
245
maxima for the species, an average ratio of 1 : 1.5 was obtained, and this
was applied as a reasonable correction to the sizes of the deep water
records. Figure 22 shows how the percentage of large species decreased
markedly with increasing depth.
For information on the relation of size to temperature in shallow
species we have drawn on Abbott (1967), Warmke and Abbott (1962)
and Olsson (1961), with some additional data from Greenland waters.
For molluscs from low water to 20 m there were sufficient data to allow
the American Atlantic and Pacific coasts to be treated separately.
The results are shown in Figs. 23 and 24. Both show the highest
30
04
0
10
20
Temperature -‘C
FIQ. 25. Peroentage of large speoies of mollusos, expressed as in Fig. 22, in relation to
temperature in the intertidal zone. Combined data for the east and west ooasta
of Amerioa.
percentages of large species at intermediate temperatures, with a marked
drop towards both polar and tropical seas. The temperatures used are
the mean values for the range of the species. Because there are
relatively few intertidal species it was necessary to combine data for
both American coasts and to use larger temperature groups. Nevertheless, these also show most large species a t mid-temperatures (Fig.
25), as might be expected in view of the pronounced stress in the intertidal zone.
Despite the fact that the proportion of large species of molluscs
decreases towards the tropics, it is in warm seas that the largest
species are found. Data on size and poleward range were taken from
various authors in “ Indo-Pacific Molluscs,” fiom Shikama and Koshi
(1963), from Abbott (1962) and from Warmke and Abbott (1967).