

242
IIILARY B. MOORE
related to latitude or temperature. We are not immediately concerned
with the mechanism of size control. Large size may result from rapid
growth, long life, suppression of gonads by parasitic castration, or
various other causes.
We have again chosen molluscs as source material since they are
well documented. If we are to compare the sizes of the typical molluscs
in different habitats, it is necessary to consider the typical sizefrequency distribution of mollusc species and what errors may be
involved in its interpretation. The curve is strongly skewed, with the
largest species much farther from the mode than the smallest. Furthermore, works such as those of Abbott (1967) and Warmke and Abbott
0
0
0 0 O
-I 4
.I
I
10
40
80
95
99.5
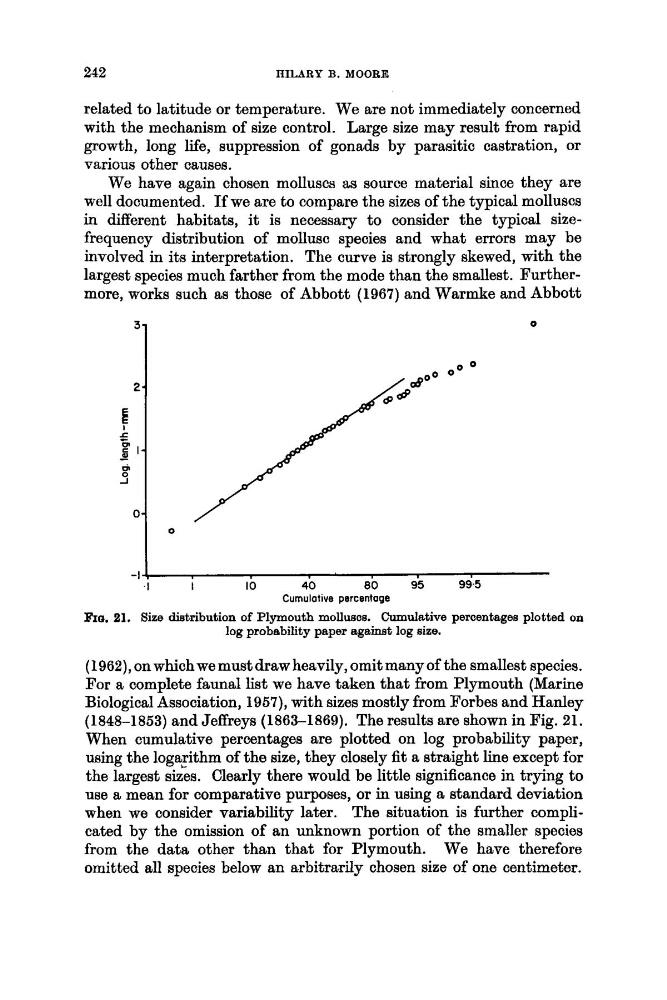
FIQ. 21. Size distribution of Plymouth molluscs. Cumdative peraentages plotted on
Cumulotive percentage
log probability paper againet log size.
(1962), on which we must draw heavily, omit many of the smallest species.
For a complete faunal list we have taken that from Plymouth (Marine
Biological Association, 1957), with sizes mostly from Forbes and Hanley
(1848-1853) and Jeffreys (1863-1869). The results are shown in Fig. 21.
When cumulative percentages are plotted on log probability paper,
using the logazithm of the size, they closely fit a straight line except for
the largest sizes. Clearly there would be little sigrdlcance in trying to
use a mean for comparative purposes, or in using a standard deviation
when we consider variability later. The situation is further complicated by the omission of an unknown portion of the smaller species
from the data other than that for Plymouth. We have therefore
omitted all species below an arbitrarily chosen size of one centimeter.
IIILARY B. MOORE
related to latitude or temperature. We are not immediately concerned
with the mechanism of size control. Large size may result from rapid
growth, long life, suppression of gonads by parasitic castration, or
various other causes.
We have again chosen molluscs as source material since they are
well documented. If we are to compare the sizes of the typical molluscs
in different habitats, it is necessary to consider the typical sizefrequency distribution of mollusc species and what errors may be
involved in its interpretation. The curve is strongly skewed, with the
largest species much farther from the mode than the smallest. Furthermore, works such as those of Abbott (1967) and Warmke and Abbott
0
0
0 0 O
-I 4
.I
I
10
40
80
95
99.5
FIQ. 21. Size distribution of Plymouth molluscs. Cumdative peraentages plotted on
Cumulotive percentage
log probability paper againet log size.
(1962), on which we must draw heavily, omit many of the smallest species.
For a complete faunal list we have taken that from Plymouth (Marine
Biological Association, 1957), with sizes mostly from Forbes and Hanley
(1848-1853) and Jeffreys (1863-1869). The results are shown in Fig. 21.
When cumulative percentages are plotted on log probability paper,
using the logazithm of the size, they closely fit a straight line except for
the largest sizes. Clearly there would be little sigrdlcance in trying to
use a mean for comparative purposes, or in using a standard deviation
when we consider variability later. The situation is further complicated by the omission of an unknown portion of the smaller species
from the data other than that for Plymouth. We have therefore
omitted all species below an arbitrarily chosen size of one centimeter.