

314
D. H. UUSRINQ
Less important than the particular point of the data in the Peruvian
upwelling is the possibility of developing a dynamic model of u p w e b
in biological terms. It would be quite easy to put a grazing term in the
equations given above, if information were available on generation time
of the herbivores of a more extensive character than that used in the
present paper. A l l estimates of upwelling velocity have been obtained
indirectly and no measurements have yet been published. So the model
developed above can only be used in model situations, unless sufficient
reliance be placed on the biological variables to use it to obtain direct
estimates of the upwelling velocity.
Figure 10 shows the gradual decay in quantity of living material
from the shore in an upwelling area. In general Thrailkill’s cha*
Station numbers
131
130
129
128 127
28
29 30 31
I
I
I
I
I
I
1
1
I
I Very dispersed I Dense
I D i s p e r s e d
I Very dense
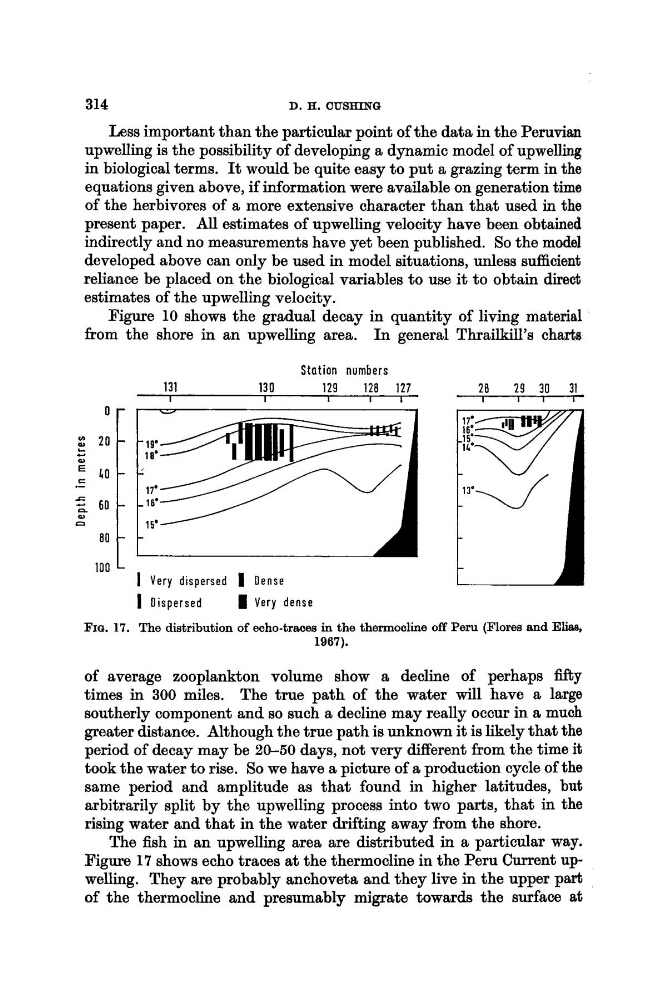
FIG. 17. The distribution of echo-traoes in the thermocline off Peru (Flores end Efiw
1967).
of average zooplankton volume show a, decline of perhaps fXty
times in 300 miles. The true path of the water will have a large
southerly component and so such a decline may really occur in a much
greater distance. Although the true path is unknown it is likely that the
period of decay may be 20-50 days, not very different from the time it
took the water to rise. So we have a picture of a production cycle of the
same period and amplitude as that found in higher latitudes, but
arbitrarily split by the upwelling process into two parts, that in the
rising water and that in the water drifting away from the shore.
The fish in an upwelling area are distributed in a particular way.
Figure 17 shows echo traces at the thermocline in the Peru Current upwelling. They are probably anchoveta and they live in the upper part
of the thermocline and presumably migrate towards the surface at
D. H. UUSRINQ
Less important than the particular point of the data in the Peruvian
upwelling is the possibility of developing a dynamic model of u p w e b
in biological terms. It would be quite easy to put a grazing term in the
equations given above, if information were available on generation time
of the herbivores of a more extensive character than that used in the
present paper. A l l estimates of upwelling velocity have been obtained
indirectly and no measurements have yet been published. So the model
developed above can only be used in model situations, unless sufficient
reliance be placed on the biological variables to use it to obtain direct
estimates of the upwelling velocity.
Figure 10 shows the gradual decay in quantity of living material
from the shore in an upwelling area. In general Thrailkill’s cha*
Station numbers
131
130
129
128 127
28
29 30 31
I
I
I
I
I
I
1
1
I
I Very dispersed I Dense
I D i s p e r s e d
I Very dense
FIG. 17. The distribution of echo-traoes in the thermocline off Peru (Flores end Efiw
1967).
of average zooplankton volume show a, decline of perhaps fXty
times in 300 miles. The true path of the water will have a large
southerly component and so such a decline may really occur in a much
greater distance. Although the true path is unknown it is likely that the
period of decay may be 20-50 days, not very different from the time it
took the water to rise. So we have a picture of a production cycle of the
same period and amplitude as that found in higher latitudes, but
arbitrarily split by the upwelling process into two parts, that in the
rising water and that in the water drifting away from the shore.
The fish in an upwelling area are distributed in a particular way.
Figure 17 shows echo traces at the thermocline in the Peru Current upwelling. They are probably anchoveta and they live in the upper part
of the thermocline and presumably migrate towards the surface at