

PLANKTON IN NITROGEN AND PHOSPHORUS CYCLES
1'31
Q
B
I
.
I
o
.
0
5
0
0 - 2.5
-0.050
-0.100
2.5- 7.5
12.5- 17.5 ~
I
o
.
0
2
s
0 100
175-200 M A M
J, J J A S O N D
, . , J , F M A M J
, a - I : W J A S O N D J F M A
1952
1953
1954
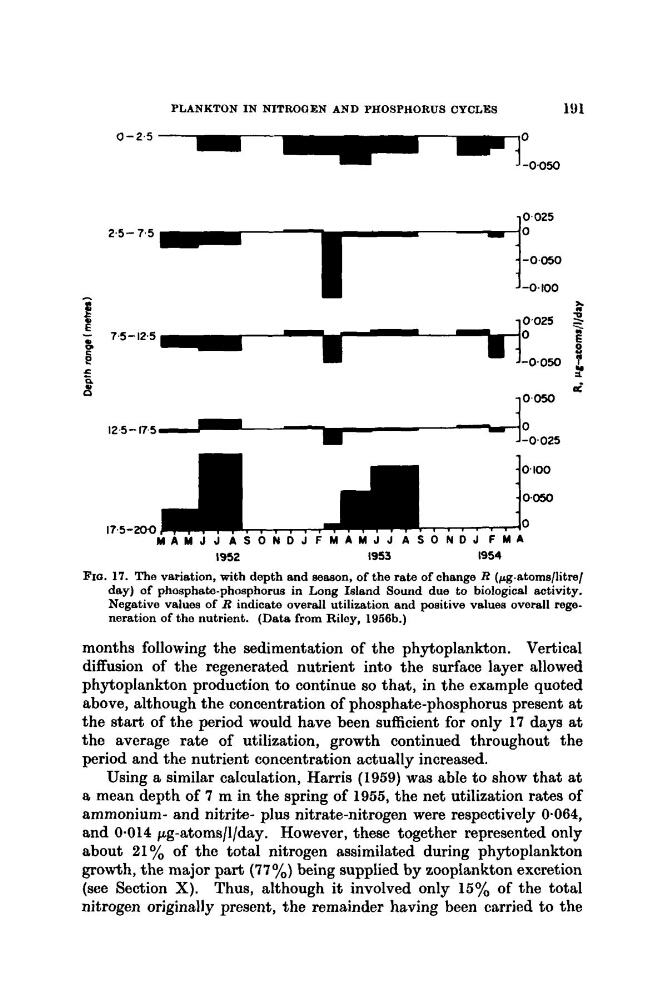
FIO. 17. The variation, with depth and mason, of the rate of change R (pg-atoms/litre/
day) of phosphate-phosphorus in Long Island Sound due to biological activity.
Negative values of R indicate overall utilization and positive values overall regeneration of the nutrient. (Data from Riley, 1956b.)
months following the sedimentation of the phytoplankton. Vertical
diffusion of the regenerated nutrient into the surface layer allowed
phytoplankton production to continue so that, in the example quoted
above, although the concentration of phosphate-phosphorus present at
the start of the period would have been sufficient for only 17 days at
the average rate of utilization, growth continued throughout the
period and the nutrient concentration actually increased.
Using a similar calculation, Harris (1959) was able to show that at
a mean depth of 7 m in the spring of 1955, the net utilization rates of
ammonium- and nitrite- plus nitrate-nitrogen were respectively 0.064,
and 0.014 pg-atoms/l/day. However, these together represented only
about 21 % of the total nitrogen assimilated during phytoplankton
growth, the major part (77%) being supplied by zooplankton excretion
(see Section X). Thus, although it involved only 15% of the total
nitrogen originally present, the remainder having been carried to the
1'31
Q
B
I
.
I
o
.
0
5
0
0 - 2.5
-0.050
-0.100
2.5- 7.5
12.5- 17.5 ~
I
o
.
0
2
s
0 100
175-200 M A M
J, J J A S O N D
, . , J , F M A M J
, a - I : W J A S O N D J F M A
1952
1953
1954
FIO. 17. The variation, with depth and mason, of the rate of change R (pg-atoms/litre/
day) of phosphate-phosphorus in Long Island Sound due to biological activity.
Negative values of R indicate overall utilization and positive values overall regeneration of the nutrient. (Data from Riley, 1956b.)
months following the sedimentation of the phytoplankton. Vertical
diffusion of the regenerated nutrient into the surface layer allowed
phytoplankton production to continue so that, in the example quoted
above, although the concentration of phosphate-phosphorus present at
the start of the period would have been sufficient for only 17 days at
the average rate of utilization, growth continued throughout the
period and the nutrient concentration actually increased.
Using a similar calculation, Harris (1959) was able to show that at
a mean depth of 7 m in the spring of 1955, the net utilization rates of
ammonium- and nitrite- plus nitrate-nitrogen were respectively 0.064,
and 0.014 pg-atoms/l/day. However, these together represented only
about 21 % of the total nitrogen assimilated during phytoplankton
growth, the major part (77%) being supplied by zooplankton excretion
(see Section X). Thus, although it involved only 15% of the total
nitrogen originally present, the remainder having been carried to the