

124
E. D. S. CORNER AND ANTHONY Q. DAVIES
I
I
I
I
I
1
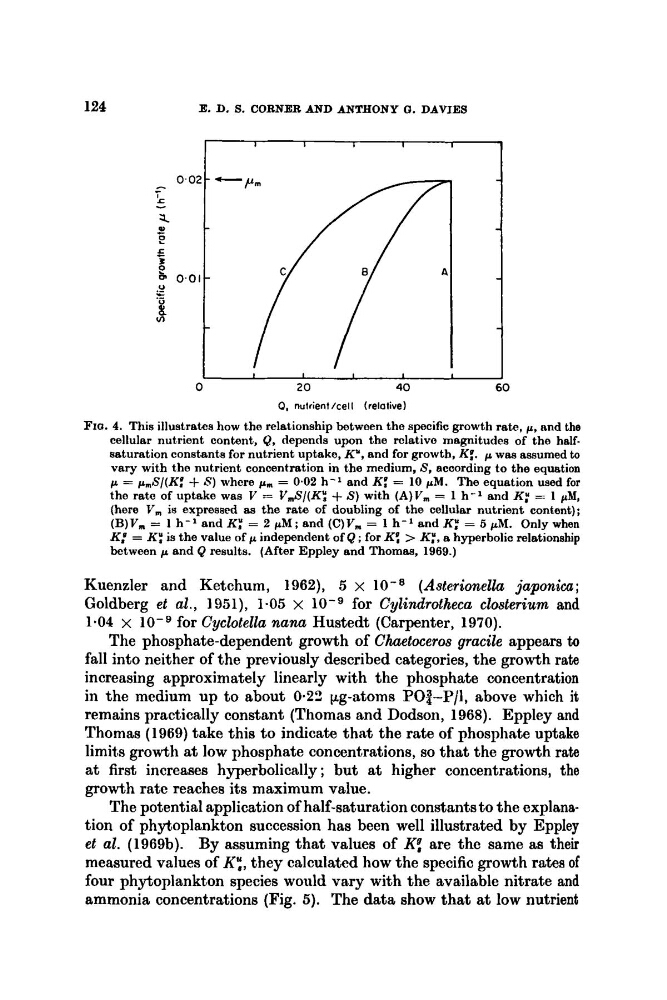
FIQ. 4. This illustrates how the relationship between the specific growth rate, p, and the
cellular nutrient content, Q, depends upon the rclative magnitudes of the halfsaturation constants for nutrient uptake, K", and for growth, K:. p was assumed to
vary with the nutrient concentration in the medium, S, according to the equation
p = p,S/(K: + 6) where pm = 0.02 h-' and K : = 10 pM. The equation used for
the rate of uptake was V = V,S/(K: $- S) with (A)Vm = 1 h-' and K: = 1 pM,
(here V, is expressed as the rate of doubling of the cellular nutrient content);
(B)Ym = 1 h-' and K : = 2 p M ; and ( C ) V , = 1 h-' and K: = 6 pM. Only when
K: = K : is the value of p independent of Q ; for KP, > K:, a hyperbolic relationship
between p and Q results. (After Eppley and Thomas, 1969.)
Kuenzler and Ketchum, 1962), 5 x
(Asterionella juponim;
Goldberg et al., 1951), 1-05 x
for Cylindrotheca closterium and
1.04 x
for Cyclotella nunu Hustedt (Carpenter, 1970).
The phosphate-dependent growth of Chaetoceros gracile appears to
fall into neither of the previously described categories, the growth rate
increasing approximately linearly with the phosphate concentration
in the medium up to about 0.23 wg-atoms PO$-P/l, above which it
remains practically constant (Thomas and Dodson, 1968). Eppley and
Thomas (1 969) take this to indicate that the rate of phosphate uptake
limits growth at low phosphate concentrations, so that the growth rate
at first increases hyperbolically ; but at higher concentrations, the
growth rate reaches its maximum value.
The potential application of half-saturation constants to the explanation of phytoplankton succession has been well illustrated by Eppley
et al. (1969b). By assuming that values of K: are the same as their
measured values of K:, they calculated how the specific growth rates of
four phytoplankton species would vary with the available nitrate and
ammonia concentrations (Fig. 5 ) . The data, show that at low nutrient
E. D. S. CORNER AND ANTHONY Q. DAVIES
I
I
I
I
I
1
FIQ. 4. This illustrates how the relationship between the specific growth rate, p, and the
cellular nutrient content, Q, depends upon the rclative magnitudes of the halfsaturation constants for nutrient uptake, K", and for growth, K:. p was assumed to
vary with the nutrient concentration in the medium, S, according to the equation
p = p,S/(K: + 6) where pm = 0.02 h-' and K : = 10 pM. The equation used for
the rate of uptake was V = V,S/(K: $- S) with (A)Vm = 1 h-' and K: = 1 pM,
(here V, is expressed as the rate of doubling of the cellular nutrient content);
(B)Ym = 1 h-' and K : = 2 p M ; and ( C ) V , = 1 h-' and K: = 6 pM. Only when
K: = K : is the value of p independent of Q ; for KP, > K:, a hyperbolic relationship
between p and Q results. (After Eppley and Thomas, 1969.)
Kuenzler and Ketchum, 1962), 5 x
(Asterionella juponim;
Goldberg et al., 1951), 1-05 x
for Cylindrotheca closterium and
1.04 x
for Cyclotella nunu Hustedt (Carpenter, 1970).
The phosphate-dependent growth of Chaetoceros gracile appears to
fall into neither of the previously described categories, the growth rate
increasing approximately linearly with the phosphate concentration
in the medium up to about 0.23 wg-atoms PO$-P/l, above which it
remains practically constant (Thomas and Dodson, 1968). Eppley and
Thomas (1 969) take this to indicate that the rate of phosphate uptake
limits growth at low phosphate concentrations, so that the growth rate
at first increases hyperbolically ; but at higher concentrations, the
growth rate reaches its maximum value.
The potential application of half-saturation constants to the explanation of phytoplankton succession has been well illustrated by Eppley
et al. (1969b). By assuming that values of K: are the same as their
measured values of K:, they calculated how the specific growth rates of
four phytoplankton species would vary with the available nitrate and
ammonia concentrations (Fig. 5 ) . The data, show that at low nutrient