

8. VISION AND BIOLUMINESCENCE
245
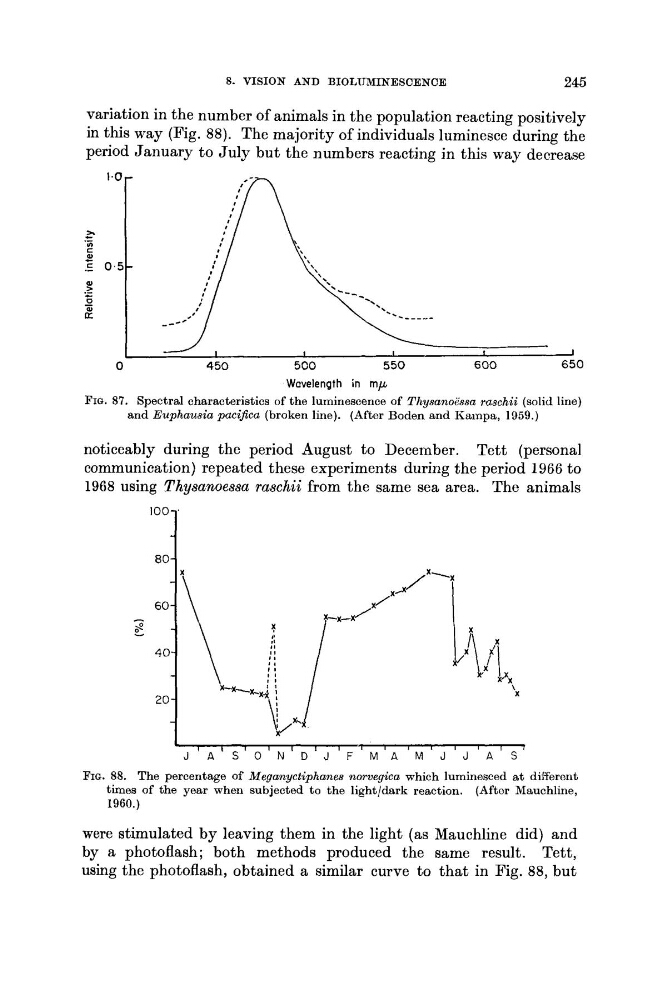
variation in the number of animals in the population reacting positively
in this way (Fig. 88). The majority of individuals luminesce during the
period January to July but the numbers reacting in this way decrease
--__-0
450
500 ,
L ,
550
600
650
wavelength in m p
FIQ. 87. Spectral characteristics of the luminescence of Thysanoissa raschii (solid line)
and Euphausia paci$ca (broken line). (After Boden and Kampa, 1969.)
noticeably during the period August to December. Tett (personal
communication) repeated these experiments during the period 1966 to
1968 using Thysunoessu raschii from the same sea area. The animals
FIQ. 88. The percentage o f Meganyctiphanes norvegica which luminesced at different
(Aftor Mauchline,
times of the year when subjected to the light/dark reaction.
1960.)
were stimulated by leaving them in the light (as Mauchline did) and
by a photoflash; both methods produced the same result. Tett,
using the photoflash, obtained a similar curve to that in Fig. 88, but
245
variation in the number of animals in the population reacting positively
in this way (Fig. 88). The majority of individuals luminesce during the
period January to July but the numbers reacting in this way decrease
--__-0
450
500 ,
L ,
550
600
650
wavelength in m p
FIQ. 87. Spectral characteristics of the luminescence of Thysanoissa raschii (solid line)
and Euphausia paci$ca (broken line). (After Boden and Kampa, 1969.)
noticeably during the period August to December. Tett (personal
communication) repeated these experiments during the period 1966 to
1968 using Thysunoessu raschii from the same sea area. The animals
FIQ. 88. The percentage o f Meganyctiphanes norvegica which luminesced at different
(Aftor Mauchline,
times of the year when subjected to the light/dark reaction.
1960.)
were stimulated by leaving them in the light (as Mauchline did) and
by a photoflash; both methods produced the same result. Tett,
using the photoflash, obtained a similar curve to that in Fig. 88, but