

218
THE BIOLOGY O F EUPHAUSIIDS
20.
specimens in each sample. The frequency distributions of the concentrations of vitamin A recorded in the 258 samples of Meganyctiphanes
norvegica and the 190 samples of Thysanoessa raschii are illustrated in
Fig. 74. The number of specimens in the samples of Meganyctiphanes
norvegica ranged between one and 359 and the modal distribution of
the vitamin A concentrations ranges between 1.2 and 10.2 pg/g wet wt.
The samples with concentrations greater than 40 pglg wet weight all
consisted of larvae. The number of specimens in the samples of Thysan' O O r
Traschii
I
I
o
200
400
600
aoo
o -
0
Body weight (mg)
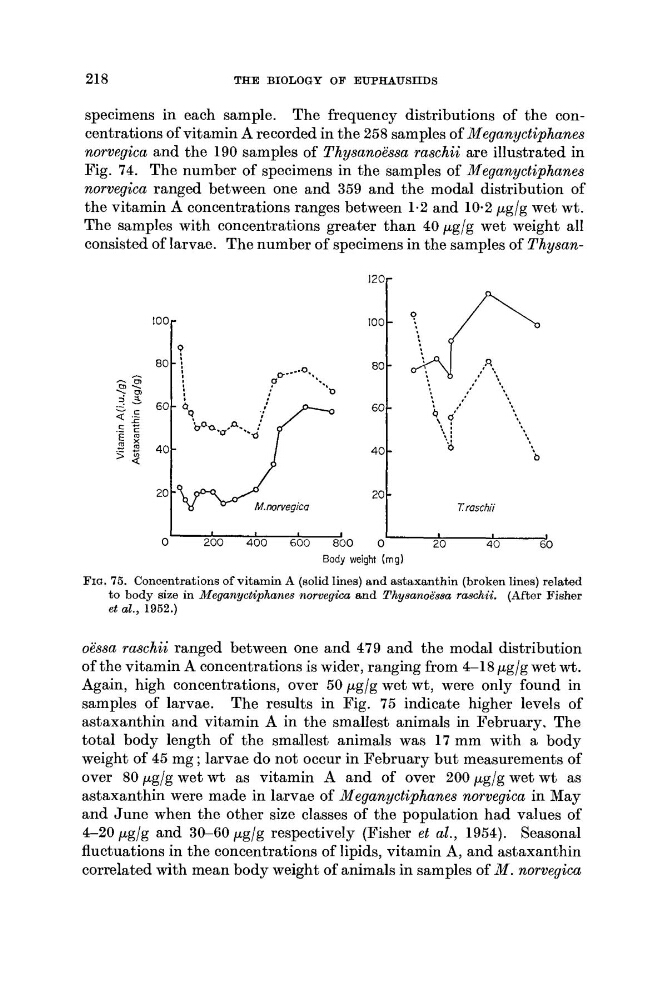
FIG. 75. Concentrations of vitamin A (solid lines) and astaxanthin (broken lines) related
to body size in Meganyctiphanes norvegica and Thysanoema raschii. (After Fisher
et al., 1952.)
oessa raschii ranged between one and 479 and the modal distribution
of the vitamin A concentrations is wider, ranging from 4-18 pg/g wet wt.
Again, high concentrations, over 50 pg/g wet wt, were only found in
samples of larvae. The results in Fig. 75 indicate higher levels of
astaxanthin and vitamin A in the smallest animals in February. The
total body length of the smallest animals was 17 mm with a body
weight of 45 mg ; larvae do not occur in February but measurements of
over 80 pg/g wet wt as vitamin A and of over 200 pglg wet wt as
astaxanthin were made in larvae of Meganyctiphanes norvegica in May
and June when the other size classes of the population had values of
4-20 pglg and 30-60 pg/g respectively (Fisher et al., 1954). Seasonal
fluctuations in the concentrations of lipids, vitamin A, and astaxanthin
correlated with mean body weight of animals in samples of M . norvegica
THE BIOLOGY O F EUPHAUSIIDS
20.
specimens in each sample. The frequency distributions of the concentrations of vitamin A recorded in the 258 samples of Meganyctiphanes
norvegica and the 190 samples of Thysanoessa raschii are illustrated in
Fig. 74. The number of specimens in the samples of Meganyctiphanes
norvegica ranged between one and 359 and the modal distribution of
the vitamin A concentrations ranges between 1.2 and 10.2 pg/g wet wt.
The samples with concentrations greater than 40 pglg wet weight all
consisted of larvae. The number of specimens in the samples of Thysan' O O r
Traschii
I
I
o
200
400
600
aoo
o -
0
Body weight (mg)
FIG. 75. Concentrations of vitamin A (solid lines) and astaxanthin (broken lines) related
to body size in Meganyctiphanes norvegica and Thysanoema raschii. (After Fisher
et al., 1952.)
oessa raschii ranged between one and 479 and the modal distribution
of the vitamin A concentrations is wider, ranging from 4-18 pg/g wet wt.
Again, high concentrations, over 50 pg/g wet wt, were only found in
samples of larvae. The results in Fig. 75 indicate higher levels of
astaxanthin and vitamin A in the smallest animals in February. The
total body length of the smallest animals was 17 mm with a body
weight of 45 mg ; larvae do not occur in February but measurements of
over 80 pg/g wet wt as vitamin A and of over 200 pglg wet wt as
astaxanthin were made in larvae of Meganyctiphanes norvegica in May
and June when the other size classes of the population had values of
4-20 pglg and 30-60 pg/g respectively (Fisher et al., 1954). Seasonal
fluctuations in the concentrations of lipids, vitamin A, and astaxanthin
correlated with mean body weight of animals in samples of M . norvegica