

246
N. A. HOLME
modified proccdurc is suggested Ly Ursin. Often the first one or two
samples fail to fit in with the straight-line plot, and Ursin has obtained
a better fit by plotting against log (n + 1) instead of log n, where n
is the number of samples.
Longhurst (lggga), however, has pointed out that the cumulative
species curve may not be a reliable method of defining the minimal
sampling area. He has shown that the most abundant species were
W
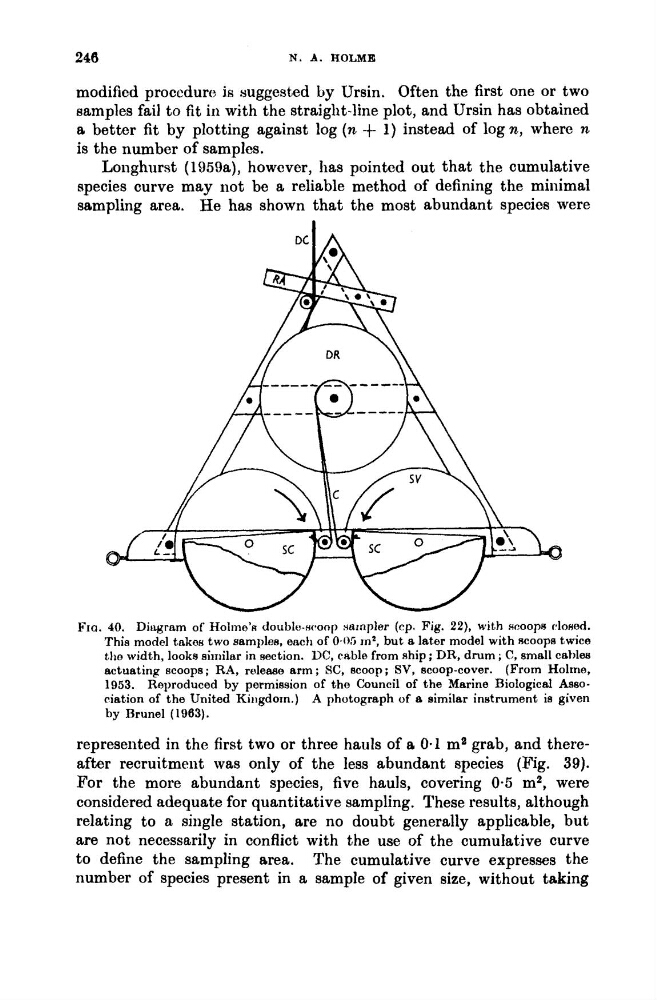
Fro. 40. Ditiyram of Holme’s doublu-sc.oop sampler (rp. Fig. 22), with s c o o p doHi?d.
This model takas two samples. each of 0.05 In*, but a later model with RCOOpS twice
the width, looks similar in section. DC, rable from ship ; DR, drum ; C, small cables
actuating scoops; RA, release arm; SC, scoop; SV, scoop-cover. (From Holme,
1953. Reproduced by permission of the Council of the Marine Biological Association of the United Kingdom.) A photograph of a similar instrument is given
by Brunel (1963).
represented in the first two or three hauls of a 0.1 ma grab, and thereafter recruitment was only of the less abundant species (Fig. 39).
For the more abundant species, five hauls, covering 0.5 m2, were
considered adequate for quantitative sampling. These results, although
relating to a single station, are no doubt generally applicable, but
are not necessarily in conflict with the use of the cumulative curve
to define the sampling area. The cumulative curve expresses the
number of species present in a sample of given size, without taking
N. A. HOLME
modified proccdurc is suggested Ly Ursin. Often the first one or two
samples fail to fit in with the straight-line plot, and Ursin has obtained
a better fit by plotting against log (n + 1) instead of log n, where n
is the number of samples.
Longhurst (lggga), however, has pointed out that the cumulative
species curve may not be a reliable method of defining the minimal
sampling area. He has shown that the most abundant species were
W
Fro. 40. Ditiyram of Holme’s doublu-sc.oop sampler (rp. Fig. 22), with s c o o p doHi?d.
This model takas two samples. each of 0.05 In*, but a later model with RCOOpS twice
the width, looks similar in section. DC, rable from ship ; DR, drum ; C, small cables
actuating scoops; RA, release arm; SC, scoop; SV, scoop-cover. (From Holme,
1953. Reproduced by permission of the Council of the Marine Biological Association of the United Kingdom.) A photograph of a similar instrument is given
by Brunel (1963).
represented in the first two or three hauls of a 0.1 ma grab, and thereafter recruitment was only of the less abundant species (Fig. 39).
For the more abundant species, five hauls, covering 0.5 m2, were
considered adequate for quantitative sampling. These results, although
relating to a single station, are no doubt generally applicable, but
are not necessarily in conflict with the use of the cumulative curve
to define the sampling area. The cumulative curve expresses the
number of species present in a sample of given size, without taking