

METIIODS OF SAMPLING THE BENTHOS
245
100% -
-
-
-
-
-
-
-
point of omitting a record because the head of the only individual in
the sample was missing.
The optimum size of quadrat, as used for sampling vegetation, is
discussed with examples from artificial populations by Curtis and
MoIntosh (1950). The marine biologist, however, has many other
factors to consider when planning work at ma, so that the ideallysized sample may prove impracticable. Sea time is often a limiting
factor, and the objective may be to sample over as large an area as time
and the weather allow. Often the numbers of samples, or of individuals
per samplc, will be too small for satisfactory treatment, so that the
results will he subject to a considerable margin of error.
- 40
in
-30 ' 0
: :
L
-20
z
- 1 0
Mean abundance of recruits (%)
- - - - I - - - - T -
1
2
4
6
8
1 0
Number of hauls (each O.lrn*)
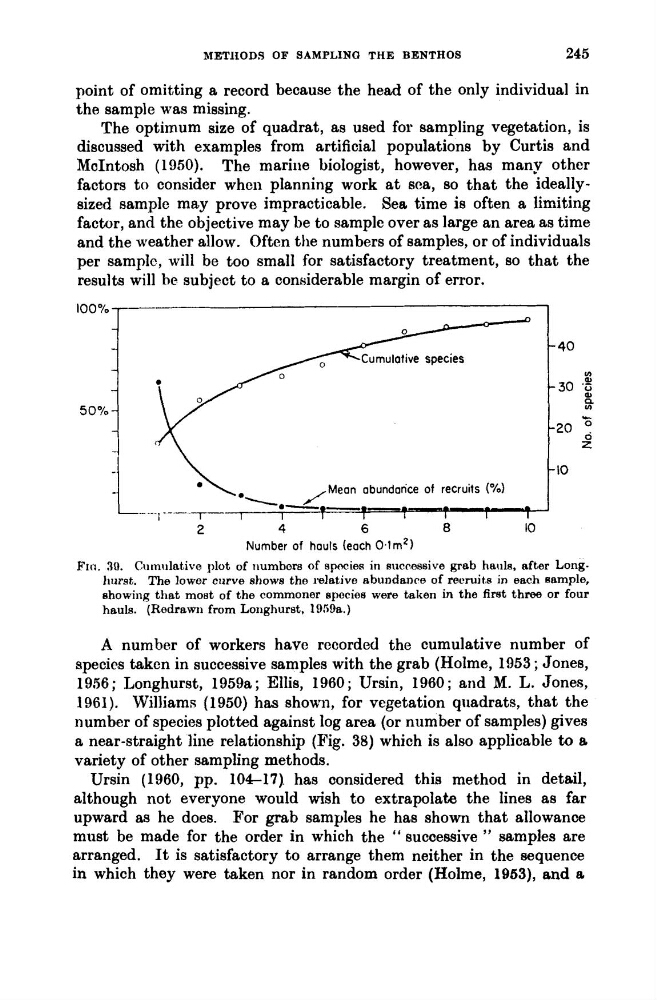
Fin. 39. Cumulative plot of iiumbors of epocies in sucressive grab hauls, after LongIlurst. The lower curve shows the relative abundanre of recruits in each sample,
showing that most of the commoner species were taken in the first three or four
hauls. (Redrawn from Longhuret, 1959a.)
A number of workers have recorded the cumulative number of
species taken in successive samples with the grab (Holme, 1953 ; Jones,
1956; Longhurst, 1959a; Ellis, 1960; Ursin, 1960; and M. L. Jones,
1961). Williams (1950) has shown, for vegetation quadrats, that the
number of species plotted against log area (or number of samples) gives
a, near-straight line relationship (Fig. 38) which is also applicable to a
variety of other sampling methods.
Ursin (1960, pp. 104-17) has considered this method in detail,
although not everyone would wish to extrapolate the lines as far
upward as he does. For grab samples he has shown that allowance
must be made for the order in which the " successive " samples are
arranged. It is Satisfactory to arrange them neither in the sequence
in which they were taken nor in random order (Holme, 1963), and a,
245
100% -
-
-
-
-
-
-
-
point of omitting a record because the head of the only individual in
the sample was missing.
The optimum size of quadrat, as used for sampling vegetation, is
discussed with examples from artificial populations by Curtis and
MoIntosh (1950). The marine biologist, however, has many other
factors to consider when planning work at ma, so that the ideallysized sample may prove impracticable. Sea time is often a limiting
factor, and the objective may be to sample over as large an area as time
and the weather allow. Often the numbers of samples, or of individuals
per samplc, will be too small for satisfactory treatment, so that the
results will he subject to a considerable margin of error.
- 40
in
-30 ' 0
: :
L
-20
z
- 1 0
Mean abundance of recruits (%)
- - - - I - - - - T -
1
2
4
6
8
1 0
Number of hauls (each O.lrn*)
Fin. 39. Cumulative plot of iiumbors of epocies in sucressive grab hauls, after LongIlurst. The lower curve shows the relative abundanre of recruits in each sample,
showing that most of the commoner species were taken in the first three or four
hauls. (Redrawn from Longhuret, 1959a.)
A number of workers have recorded the cumulative number of
species taken in successive samples with the grab (Holme, 1953 ; Jones,
1956; Longhurst, 1959a; Ellis, 1960; Ursin, 1960; and M. L. Jones,
1961). Williams (1950) has shown, for vegetation quadrats, that the
number of species plotted against log area (or number of samples) gives
a, near-straight line relationship (Fig. 38) which is also applicable to a
variety of other sampling methods.
Ursin (1960, pp. 104-17) has considered this method in detail,
although not everyone would wish to extrapolate the lines as far
upward as he does. For grab samples he has shown that allowance
must be made for the order in which the " successive " samples are
arranged. It is Satisfactory to arrange them neither in the sequence
in which they were taken nor in random order (Holme, 1963), and a,