

POPULATION CYCLES I N SMALL MAMMALS
377
TfE
frequency
decreasing
Tf
frequency
increasing
78
4 3
( 56.5 )
(64.5
3 5
8 6
( 56.5 )
(64.5 1
X 2= 30.70
~ ( 0 . 0 0 5
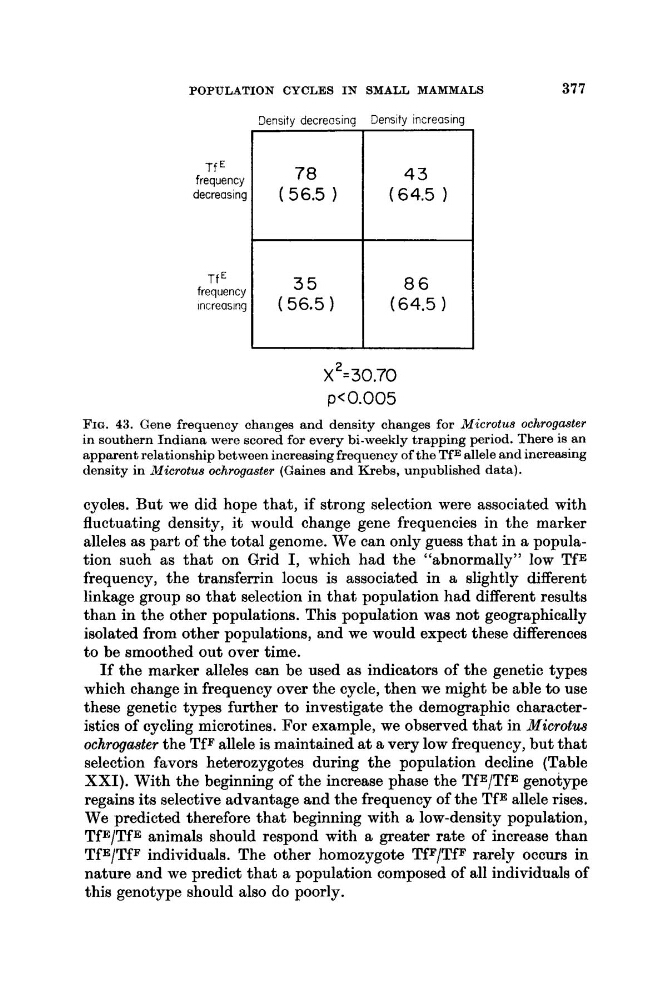
FIG. 43. Gene frequency changes and density changes for Microtus ochrogaster
in southern Indiana were scored for every bi-weekly trapping period. There is an
apparent relationship between increasing frequency of the TfE allele and increasing
density in Microtus ochrogaster (Gaines and Krebs, unpublished data).
cycles. But we did hope that, if strong selection were associated with
fluctuating density, it would change gene frequencies in the marker
alleles as part of the total genome. We can only guess that in a population such as that on Grid I, which had the “abnormally” low TfE
frequency, the transferrin locus is associated in a slightly different
linkage group so that selection in that population had different results
than in the other populations. This population was not geographically
isolated from other populations, and we would expect these differences
to be smoothed out over time.
If the marker alleles can be used as indicators of the genetic types
which change in frequency over the cycle, then we might be able to use
these genetic types further to investigate the demographic characteristics of cycling microtines. For example, we observed that in Microtus
ochrogaster the TfF allele is maintained at a very low frequency, but that
selection favors heterozygotes during the population decline (Table
XXI). With the beginning of the increase phase the TfE/TfE genotype
regains its selective advantage and the frequency of the TfE allele rises.
We predicted therefore that beginning with a low-density population,
TfE/TfE animals should respond with a greater rate of increase than
TfE/TfF individuals. The other homozygote W / T F rarely occurs in
nature and we predict that a population composed of all individuals of
this genotype should also do poorly.
377
TfE
frequency
decreasing
Tf
frequency
increasing
78
4 3
( 56.5 )
(64.5
3 5
8 6
( 56.5 )
(64.5 1
X 2= 30.70
~ ( 0 . 0 0 5
FIG. 43. Gene frequency changes and density changes for Microtus ochrogaster
in southern Indiana were scored for every bi-weekly trapping period. There is an
apparent relationship between increasing frequency of the TfE allele and increasing
density in Microtus ochrogaster (Gaines and Krebs, unpublished data).
cycles. But we did hope that, if strong selection were associated with
fluctuating density, it would change gene frequencies in the marker
alleles as part of the total genome. We can only guess that in a population such as that on Grid I, which had the “abnormally” low TfE
frequency, the transferrin locus is associated in a slightly different
linkage group so that selection in that population had different results
than in the other populations. This population was not geographically
isolated from other populations, and we would expect these differences
to be smoothed out over time.
If the marker alleles can be used as indicators of the genetic types
which change in frequency over the cycle, then we might be able to use
these genetic types further to investigate the demographic characteristics of cycling microtines. For example, we observed that in Microtus
ochrogaster the TfF allele is maintained at a very low frequency, but that
selection favors heterozygotes during the population decline (Table
XXI). With the beginning of the increase phase the TfE/TfE genotype
regains its selective advantage and the frequency of the TfE allele rises.
We predicted therefore that beginning with a low-density population,
TfE/TfE animals should respond with a greater rate of increase than
TfE/TfF individuals. The other homozygote W / T F rarely occurs in
nature and we predict that a population composed of all individuals of
this genotype should also do poorly.