

360
CHdRLES J. KREBS AND JUDITH H. MYERS
laboratory, showed that none of these hematological factors seemed to
vary with artificially imposed density levels. Secondly, the densities of
field populations given by Mullen (1965) do not agree with the trapping
data of Pitelka (1972) for the same vicinity at Barrow, Alaska. Mullen
refers to the summer of 1963 as a peak year while Pitelka’s data indicate
that it was a year of low numbers. This conflict might be explained by
the fact that Mullen trapped periodically during the winter of 19621963. Therefore, numbers may have been high and declined before
8000
1960
1961
1962
1963
LAB
PEAK
LOW
LOW
LOW
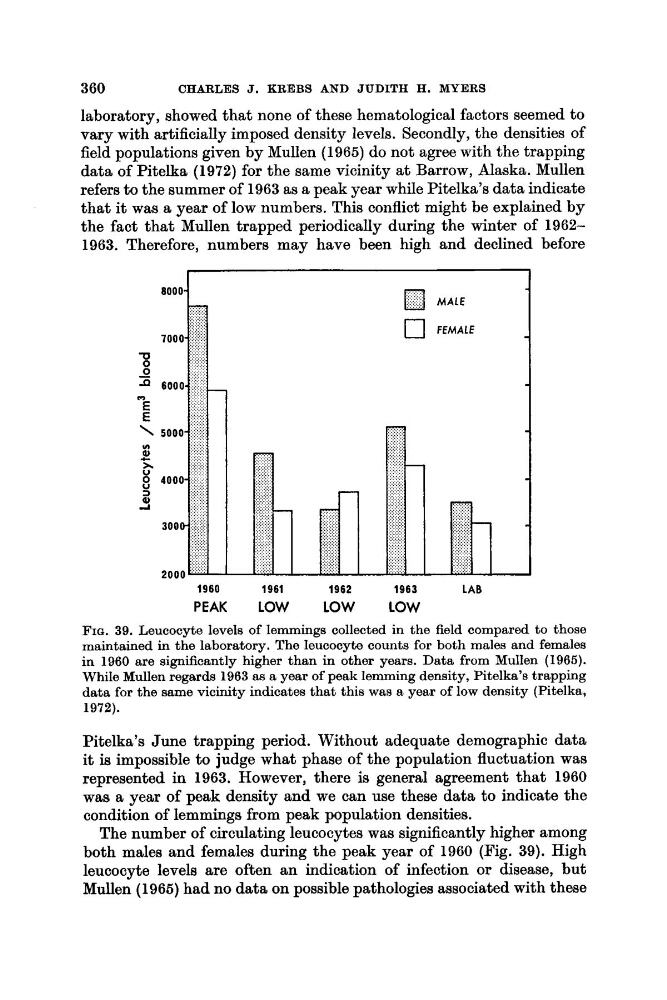
FIG. 39. Leucocyte levels of lemmings collected in the field compared to those
maintained in the laboratory. The leucocyte counts for both males and females
in 1960 are significantly higher than in other years. Data from Mullen (1966).
While Mullen regards 1963 a year of peak lemming density, Pitelka’s trapping
data for the same vicinity indicates that this was a year of low density (Pitelka,
1972).
Pitelka’s June trapping period. Without adequate demographic data
it is impossible to judge what phase of the population fluctuation was
represented in 1963. However, there is general agreement that 1960
was a year of peak density and we can use these data to indicate the
condition of lemmings from peak population densities.
The number of circulating leucocytes was significantly higher among
both males and females during the peak year of 1960 (Fig. 39). High
leucocyte levels are often an indication of infection or disease, but
Mullen (1965) had no data on possible pathologies associated with these
CHdRLES J. KREBS AND JUDITH H. MYERS
laboratory, showed that none of these hematological factors seemed to
vary with artificially imposed density levels. Secondly, the densities of
field populations given by Mullen (1965) do not agree with the trapping
data of Pitelka (1972) for the same vicinity at Barrow, Alaska. Mullen
refers to the summer of 1963 as a peak year while Pitelka’s data indicate
that it was a year of low numbers. This conflict might be explained by
the fact that Mullen trapped periodically during the winter of 19621963. Therefore, numbers may have been high and declined before
8000
1960
1961
1962
1963
LAB
PEAK
LOW
LOW
LOW
FIG. 39. Leucocyte levels of lemmings collected in the field compared to those
maintained in the laboratory. The leucocyte counts for both males and females
in 1960 are significantly higher than in other years. Data from Mullen (1966).
While Mullen regards 1963 a year of peak lemming density, Pitelka’s trapping
data for the same vicinity indicates that this was a year of low density (Pitelka,
1972).
Pitelka’s June trapping period. Without adequate demographic data
it is impossible to judge what phase of the population fluctuation was
represented in 1963. However, there is general agreement that 1960
was a year of peak density and we can use these data to indicate the
condition of lemmings from peak population densities.
The number of circulating leucocytes was significantly higher among
both males and females during the peak year of 1960 (Fig. 39). High
leucocyte levels are often an indication of infection or disease, but
Mullen (1965) had no data on possible pathologies associated with these