

POPULATION CYCLES IN SMALL MAMMALS
323
TABLE XI1
Peak population densities in Clethrionomys
Density
Species
Author
30/acre
1 O/acre
Approx. 30/acre
Approx. 30/acre
lO/acre
14/acre
Approx. 30/acre
Approx. 70/acre
20-40/acre
C. rutilus
C. rutilus
C. rutilus
C. rutilus
C. gapperi
C. gapperi
C. glareolus
C . glareolus
C. glareolus
Whitney (unpublished)
Fuller (1969)
Koshkina (1965)
Pruitt (1968)
Fuller (1969)
Elliott (1969)
Ashby (1967)
Newson (1963)
Petrusewicz et al. (197 1)
tion data on a microtine is that of Koshkina (1966) shown in Fig. 3.
These data are for C. rufocanus (a greens eater) and show regular
population fluctuations. Density data for C. rutilus (a seeds eater) in
the Russian taiga are included in Fig. 16, based on the data of Koshkina
(1965). Of the seven years of the study (1958-1964) two years of peak
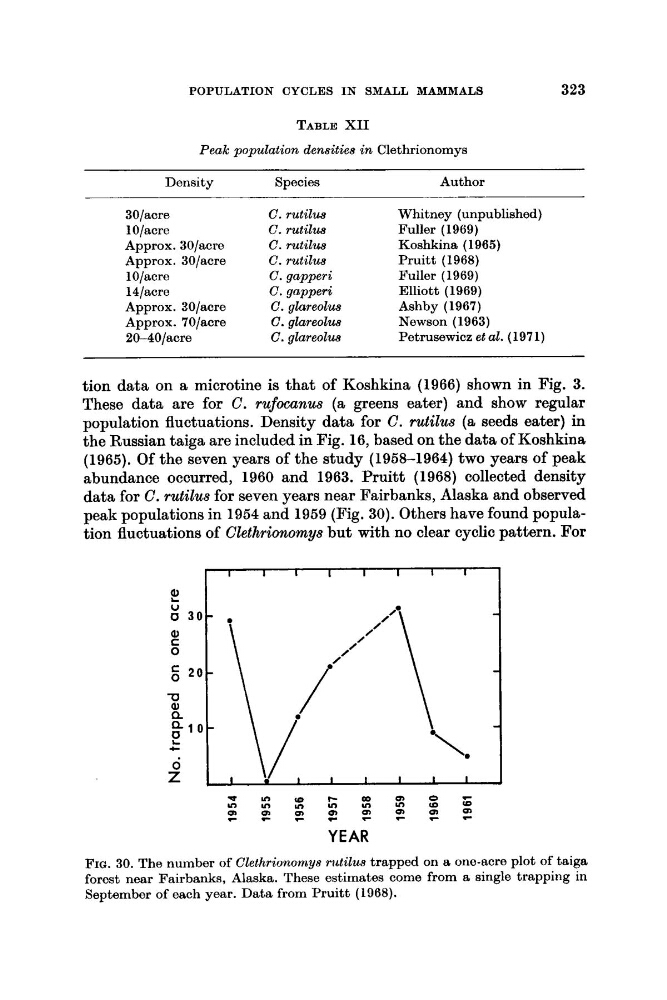
abundance occurred, 1960 and 1963. Pruitt (1968) collected density
data for C. rutilus for seven years near Fairbanks, Alaska and observed
peak populations in 1954 and 1959 (Fig. 30). Others have found population fluctuations of Clethrionomys but with no clear cyclic pattern. For
YEAR
FIG. 30. The number of Clethrionomys mrtilus trapped on a one-acre plot of taiga
forest near Fairbanks, Alaska. These estimates come from a single trapping in
September of each year. Data from Pruitt (1968).
323
TABLE XI1
Peak population densities in Clethrionomys
Density
Species
Author
30/acre
1 O/acre
Approx. 30/acre
Approx. 30/acre
lO/acre
14/acre
Approx. 30/acre
Approx. 70/acre
20-40/acre
C. rutilus
C. rutilus
C. rutilus
C. rutilus
C. gapperi
C. gapperi
C. glareolus
C . glareolus
C. glareolus
Whitney (unpublished)
Fuller (1969)
Koshkina (1965)
Pruitt (1968)
Fuller (1969)
Elliott (1969)
Ashby (1967)
Newson (1963)
Petrusewicz et al. (197 1)
tion data on a microtine is that of Koshkina (1966) shown in Fig. 3.
These data are for C. rufocanus (a greens eater) and show regular
population fluctuations. Density data for C. rutilus (a seeds eater) in
the Russian taiga are included in Fig. 16, based on the data of Koshkina
(1965). Of the seven years of the study (1958-1964) two years of peak
abundance occurred, 1960 and 1963. Pruitt (1968) collected density
data for C. rutilus for seven years near Fairbanks, Alaska and observed
peak populations in 1954 and 1959 (Fig. 30). Others have found population fluctuations of Clethrionomys but with no clear cyclic pattern. For
YEAR
FIG. 30. The number of Clethrionomys mrtilus trapped on a one-acre plot of taiga
forest near Fairbanks, Alaska. These estimates come from a single trapping in
September of each year. Data from Pruitt (1968).