

z .
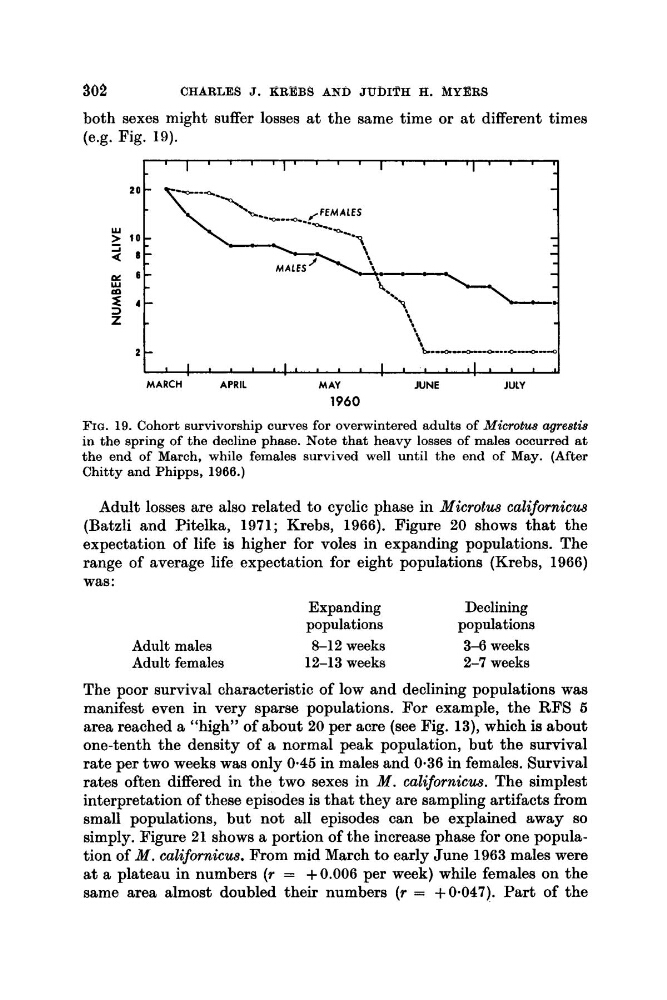
FIG. 19. Cohort survivorship curves for overwintered adults of Microtw, agrestie
in the spring of the decline phase. Note that heavy losses of males occurred a t
the end of March, while females survived well until the end of May. (After
Chitty and Phipps, 1900.)
i t
',
2 -
b.-e-----~-..o.-.a.-4
I
I
t
I
I
, I ,
I
I
I
1
1
1
1
1
I
I
L
Adult losses are also related to cyclic phase in Microtus californicus
(Batzli and Pitelka, 1971; Krebs, 1966). Figure 20 shows that the
expectation of life is higher for voles in expanding populations. The
range of average life expectation for eight populations (Krebs, 1966)
was:
Expanding
Declining
populations
populations
Adult males
8-12 weeks
3-6 weeks
Adult females
12-13 weeks
2-7 weeks
The poor survival characteristic of low and declining populations was
manifest even in very sparse populations. For example, the RFS 6
area reached a "high" of about 20 per acre (see Fig. 13), which is about
one-tenth the density of a normal peak population, but the survival
rate per two weeks was only 0.45 in males and 0.36 in females. Survival
rates often differed in the two sexes in M . californicus. The simplest
interpretation of these episodes is that they are sampling artifacts from
small populations, but not all episodes can be explained away so
simply. Figure 21 shows a portion of the increase phase for one population of M . californicus. From mid March to early June 1963 males were
at a plateau in numbers (r = +0.006 per week) while females on the
same area almost doubled their numbers (r = +0.047). Part of the
FIG. 19. Cohort survivorship curves for overwintered adults of Microtw, agrestie
in the spring of the decline phase. Note that heavy losses of males occurred a t
the end of March, while females survived well until the end of May. (After
Chitty and Phipps, 1900.)
i t
',
2 -
b.-e-----~-..o.-.a.-4
I
I
t
I
I
, I ,
I
I
I
1
1
1
1
1
I
I
L
Adult losses are also related to cyclic phase in Microtus californicus
(Batzli and Pitelka, 1971; Krebs, 1966). Figure 20 shows that the
expectation of life is higher for voles in expanding populations. The
range of average life expectation for eight populations (Krebs, 1966)
was:
Expanding
Declining
populations
populations
Adult males
8-12 weeks
3-6 weeks
Adult females
12-13 weeks
2-7 weeks
The poor survival characteristic of low and declining populations was
manifest even in very sparse populations. For example, the RFS 6
area reached a "high" of about 20 per acre (see Fig. 13), which is about
one-tenth the density of a normal peak population, but the survival
rate per two weeks was only 0.45 in males and 0.36 in females. Survival
rates often differed in the two sexes in M . californicus. The simplest
interpretation of these episodes is that they are sampling artifacts from
small populations, but not all episodes can be explained away so
simply. Figure 21 shows a portion of the increase phase for one population of M . californicus. From mid March to early June 1963 males were
at a plateau in numbers (r = +0.006 per week) while females on the
same area almost doubled their numbers (r = +0.047). Part of the