

292
CHARLES J . KREBS AND JUDITH H. MYERS
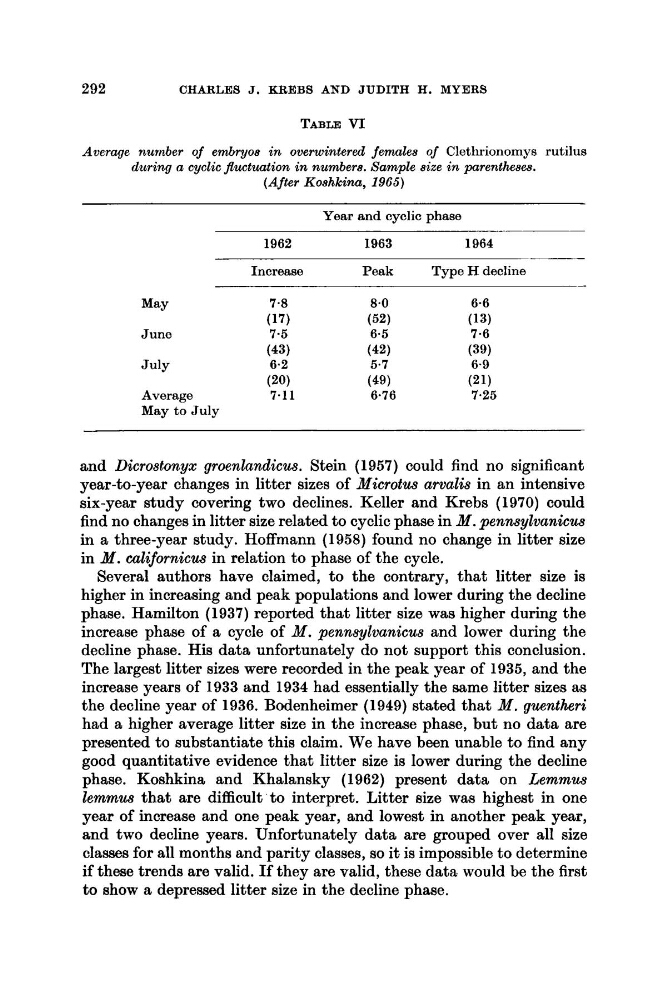
TABLE VI
Average number of embryos in overwintered females of Clethrionomys rutilus
during a cyclic Juctuation in numbers. Sample size in parentheses.
(After Koshkina, 1965)
Year and cyclic phase
1962
1963
1964
Increase
Peak
Type H decline
May
7.8
8.0
6-6
(17)
(52)
(13)
June
7.5
6.5
7.6
(43)
(42)
(39)
July
6-2
5.7
6.9
(20)
(49)
(21)
Average
7.11
6.76
7.25
May to July
and Dicrostonyx groenlandicus. Stein (1957) could find no significant
year-to-year changes in litter sizes of Microtus arvalis in an intensive
six-year study covering two declines. Keller and Krebs (1970) could
find no changes in litter size related to cyclic phase in M . pennsylvanicus
in a three-year study. Hoffmann (1958) found no change in litter size
in M . californicus in relation to phase of the cycle.
Several authors have claimed, to the contrary, that litter size is
higher in increasing and peak populations and lower during the decline
phase. Hamilton (1937) reported that litter size was higher during the
increase phase of a cycle of Af. pennsylvanicus and lower during the
decline phase. His data unfortunately do not support this conclusion.
The largest litter sizes were recorded in the peak year of 1935, and the
increase years of 1933 and 1934 had essentially the same litter sizes as
the decline year of 1936. Bodenheimer (1949) stated that M . guenthri
had a higher average litter size in the increase phase, but no data are
presented to substantiate this claim. We have been unable to find any
good quantitative evidence that litter size is lower during the decline
phase. Koshkina and Khalansky (1962) present data on Lemmus
lemmus that are difficult to interpret. Litter size was highest in one
year of increase and one peak year, and lowest in another peak year,
and two decline years. Unfortunately data are grouped over all size
classes for all months and parity classes, so it is impossible to determine
if these trends are valid. If they are valid, these data would be the first
to show a depressed litter size in the decline phase.
CHARLES J . KREBS AND JUDITH H. MYERS
TABLE VI
Average number of embryos in overwintered females of Clethrionomys rutilus
during a cyclic Juctuation in numbers. Sample size in parentheses.
(After Koshkina, 1965)
Year and cyclic phase
1962
1963
1964
Increase
Peak
Type H decline
May
7.8
8.0
6-6
(17)
(52)
(13)
June
7.5
6.5
7.6
(43)
(42)
(39)
July
6-2
5.7
6.9
(20)
(49)
(21)
Average
7.11
6.76
7.25
May to July
and Dicrostonyx groenlandicus. Stein (1957) could find no significant
year-to-year changes in litter sizes of Microtus arvalis in an intensive
six-year study covering two declines. Keller and Krebs (1970) could
find no changes in litter size related to cyclic phase in M . pennsylvanicus
in a three-year study. Hoffmann (1958) found no change in litter size
in M . californicus in relation to phase of the cycle.
Several authors have claimed, to the contrary, that litter size is
higher in increasing and peak populations and lower during the decline
phase. Hamilton (1937) reported that litter size was higher during the
increase phase of a cycle of Af. pennsylvanicus and lower during the
decline phase. His data unfortunately do not support this conclusion.
The largest litter sizes were recorded in the peak year of 1935, and the
increase years of 1933 and 1934 had essentially the same litter sizes as
the decline year of 1936. Bodenheimer (1949) stated that M . guenthri
had a higher average litter size in the increase phase, but no data are
presented to substantiate this claim. We have been unable to find any
good quantitative evidence that litter size is lower during the decline
phase. Koshkina and Khalansky (1962) present data on Lemmus
lemmus that are difficult to interpret. Litter size was highest in one
year of increase and one peak year, and lowest in another peak year,
and two decline years. Unfortunately data are grouped over all size
classes for all months and parity classes, so it is impossible to determine
if these trends are valid. If they are valid, these data would be the first
to show a depressed litter size in the decline phase.