

’OPULATION CYCLES I N SMALL MAMMALS
285
,
I
I
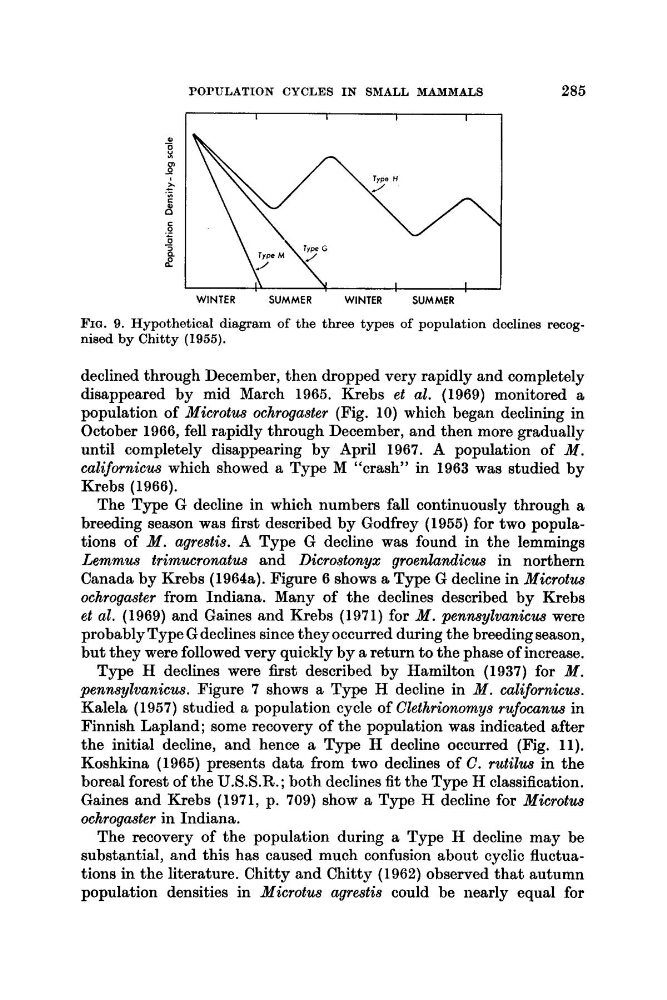
FIG. 9. Hypothetical diagram of the three types of population declines recognised by Chitty (1955).
declined through December, then dropped very rapidly and completely
disappeared by mid March 1965. Krebs et al. (1969) monitored a
population of Microtus ochrogaster (Fig. 10) which began declining in
October 1966, fell rapidly through December, and then more gradually
until completely disappearing by April 1967. A population of M .
californicus which showed a Type M “crash” in 1963 was studied by
Krebs (1966).
The Type G decline in which numbers fall continuously through a
breeding season was first described by Godfrey (1955) for two populations of M . agrestis. A Type G decline was found in the lemmings
Lemmus trimucronatus and Dicrostonyx groenlandicus in northern
Canada by Krebs (1964a). Figure 6 shows a Type G decline in Microtus
ochrogaster from Indiana. Many of the declines described by Krebs
et al. (1969) and Gaines and Krebs (1971) for M . penwylvanicus were
probably Type G declines since they occurred during the breeding season,
but they were followed very quickly by a return to the phase of increase.
Type H declines were first described by Hamilton (1937) for M .
pennsylvanicus. Figure 7 shows a Type H decline in M . californicus.
Kalela (1957) studied a population cycle of Clethrionomys rufocanus in
Finnish Lapland; some recovery of the population was indicated after
the initial decline, and hence a Type H decline occurred (Fig. 11).
Koshkina (1965) presents data from two declines of C. rutilus in the
boreal forest of the U.S.S.R.; both declines fit the Type H classification.
Gaines and Krebs (1971, p. 709) show a Type H decline for Microtus
ochrogaster in Indiana.
The recovery of the population during a Type H decline may be
substantial, and this has caused much confusion about cyclic fluctuations in the literature. Chitty and Chitty (1962) observed that autumn
population densities in Microtus agrestis could be nearly equal for
285
,
I
I
FIG. 9. Hypothetical diagram of the three types of population declines recognised by Chitty (1955).
declined through December, then dropped very rapidly and completely
disappeared by mid March 1965. Krebs et al. (1969) monitored a
population of Microtus ochrogaster (Fig. 10) which began declining in
October 1966, fell rapidly through December, and then more gradually
until completely disappearing by April 1967. A population of M .
californicus which showed a Type M “crash” in 1963 was studied by
Krebs (1966).
The Type G decline in which numbers fall continuously through a
breeding season was first described by Godfrey (1955) for two populations of M . agrestis. A Type G decline was found in the lemmings
Lemmus trimucronatus and Dicrostonyx groenlandicus in northern
Canada by Krebs (1964a). Figure 6 shows a Type G decline in Microtus
ochrogaster from Indiana. Many of the declines described by Krebs
et al. (1969) and Gaines and Krebs (1971) for M . penwylvanicus were
probably Type G declines since they occurred during the breeding season,
but they were followed very quickly by a return to the phase of increase.
Type H declines were first described by Hamilton (1937) for M .
pennsylvanicus. Figure 7 shows a Type H decline in M . californicus.
Kalela (1957) studied a population cycle of Clethrionomys rufocanus in
Finnish Lapland; some recovery of the population was indicated after
the initial decline, and hence a Type H decline occurred (Fig. 11).
Koshkina (1965) presents data from two declines of C. rutilus in the
boreal forest of the U.S.S.R.; both declines fit the Type H classification.
Gaines and Krebs (1971, p. 709) show a Type H decline for Microtus
ochrogaster in Indiana.
The recovery of the population during a Type H decline may be
substantial, and this has caused much confusion about cyclic fluctuations in the literature. Chitty and Chitty (1962) observed that autumn
population densities in Microtus agrestis could be nearly equal for