

282
CHARLES J. KREBS AND JUDITH H. MYERS
TABLE 111 (contd.)
Species
Time period
Mean r
Reference
Dicrostonyx
Sept. 1959-May 1960
0.042 Krebs (1964a)
groenlandiczls
Clethrionomys
June-Sept. 1954
0.146 Kalela (1957)
mfocanzls
are from an island population (see later discussion). One very high
r value for Microtus ochrogmter (0.231) was probably enhanced by
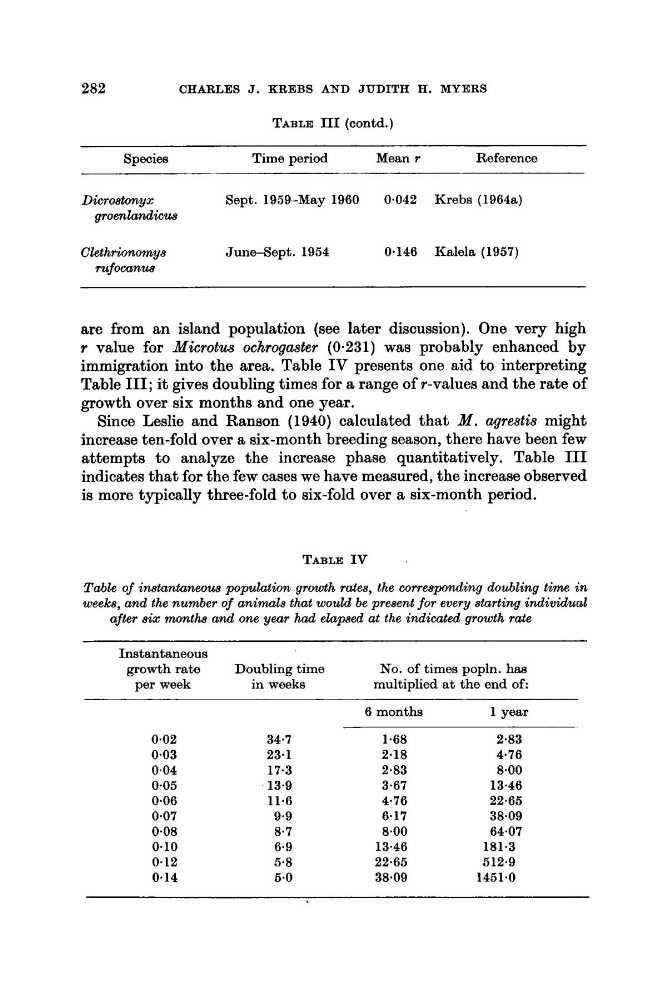
immigration into the area. Table I V presents one aid t o interpreting
Table 111; it gives doubling times for a range of r-values and the rate of
growth over six months and one year.
Since Leslie and Ranson (1940) calculated that M. agrestis might
increase ten-fold over a six-month breeding season, there have been few
attempts to analyze the increase phase quantitatively. Table I11
indicates that for the few cases we have measured, the increase observed
is more typically three-fold to six-fold over a six-month period.
TABLE IV
Table of instantaneous population growth rates, the corresponding doubling time in
weeks, and the number of animals that would be present for every starting individual
after six months and one year had elapsed at the indicated growth rate
Instantaneous
growth rate
Doubling time
No. of times popln. has
per week
in weeks
multiplied a t the end of:
6 months
1 year
0.02
0.03
0.04
0-05
0.06
0.07
0-08
0.10
0.12
0.14
34.7
23- 1
17-3
13.9
11.6
9.9
8.7
6.9
5.8
5.0
1.68
2.18
2.83
3.67
4.76
6.17
8.00
13.46
22-65
38.09
2.83
4.76
8.00
13.46
22.65
38.09
64.07
181.3
512.9
1451.0
CHARLES J. KREBS AND JUDITH H. MYERS
TABLE 111 (contd.)
Species
Time period
Mean r
Reference
Dicrostonyx
Sept. 1959-May 1960
0.042 Krebs (1964a)
groenlandiczls
Clethrionomys
June-Sept. 1954
0.146 Kalela (1957)
mfocanzls
are from an island population (see later discussion). One very high
r value for Microtus ochrogmter (0.231) was probably enhanced by
immigration into the area. Table I V presents one aid t o interpreting
Table 111; it gives doubling times for a range of r-values and the rate of
growth over six months and one year.
Since Leslie and Ranson (1940) calculated that M. agrestis might
increase ten-fold over a six-month breeding season, there have been few
attempts to analyze the increase phase quantitatively. Table I11
indicates that for the few cases we have measured, the increase observed
is more typically three-fold to six-fold over a six-month period.
TABLE IV
Table of instantaneous population growth rates, the corresponding doubling time in
weeks, and the number of animals that would be present for every starting individual
after six months and one year had elapsed at the indicated growth rate
Instantaneous
growth rate
Doubling time
No. of times popln. has
per week
in weeks
multiplied a t the end of:
6 months
1 year
0.02
0.03
0.04
0-05
0.06
0.07
0-08
0.10
0.12
0.14
34.7
23- 1
17-3
13.9
11.6
9.9
8.7
6.9
5.8
5.0
1.68
2.18
2.83
3.67
4.76
6.17
8.00
13.46
22-65
38.09
2.83
4.76
8.00
13.46
22.65
38.09
64.07
181.3
512.9
1451.0