

280
CHARLES J. KREBS AND JUDITH H. MYERS
which occupies one year or less. Table I1 shows that a number of
populations studied by Chitty and Chitty (1962) went through the
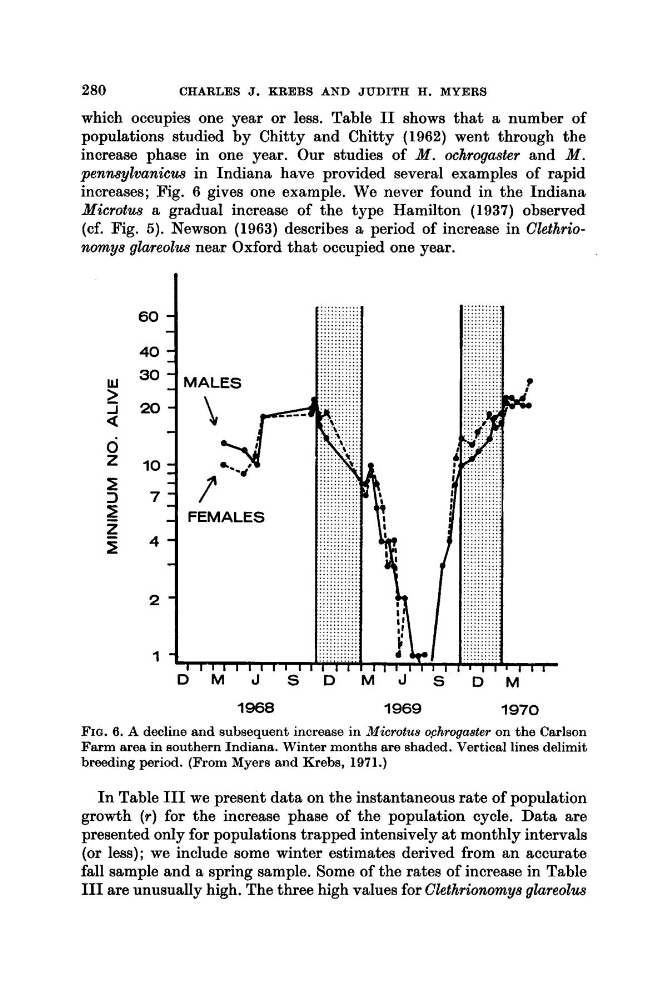
increase phase in one year. Our studies of M . ochrogaster and M .
pennsylvanicus in Indiana have provided several examples of rapid
increases; Fig. 6 gives one example. We never found in the Indiana
Microtus a gradual increase of the type Hamilton (1937) observed
(cf. Fig. 5). Newson (1963) describes a period of increase in Clethrionomys glareolus near Oxford that occupied one year.
9
i
a
0
z
60
40
30
20
10
7
4
2
1
1968
1969
1970
FIG. 6. A decline and subsequent increase in Microtus ophrogaster on the Carlson
Farm area in southern Indiana. Winter months are shaded. Vertical lines delimit
breeding period. (From Myers and Krebs, 1971.)
In Table I11 we present data on the instantaneous rate of population
growth ( r ) for the increase phase of the population cycle. Data are
presented only for populations trapped intensively at monthly intervals
(or less); we include some winter estimates derived from an accurate
fall sample and a spring sample. Some of the rates of increase in Table
I11 are unusually high. The three high values for Clethrionomys glareolus
CHARLES J. KREBS AND JUDITH H. MYERS
which occupies one year or less. Table I1 shows that a number of
populations studied by Chitty and Chitty (1962) went through the
increase phase in one year. Our studies of M . ochrogaster and M .
pennsylvanicus in Indiana have provided several examples of rapid
increases; Fig. 6 gives one example. We never found in the Indiana
Microtus a gradual increase of the type Hamilton (1937) observed
(cf. Fig. 5). Newson (1963) describes a period of increase in Clethrionomys glareolus near Oxford that occupied one year.
9
i
a
0
z
60
40
30
20
10
7
4
2
1
1968
1969
1970
FIG. 6. A decline and subsequent increase in Microtus ophrogaster on the Carlson
Farm area in southern Indiana. Winter months are shaded. Vertical lines delimit
breeding period. (From Myers and Krebs, 1971.)
In Table I11 we present data on the instantaneous rate of population
growth ( r ) for the increase phase of the population cycle. Data are
presented only for populations trapped intensively at monthly intervals
(or less); we include some winter estimates derived from an accurate
fall sample and a spring sample. Some of the rates of increase in Table
I11 are unusually high. The three high values for Clethrionomys glareolus